Agriculture Reference
In-Depth Information
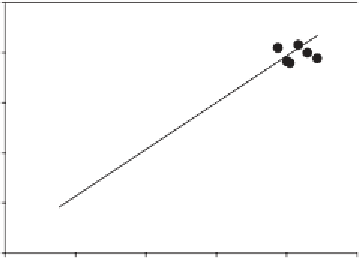
calibration equation developed for an unrelated
wheat population. A similar prediction using NIR
is given for CID measured using a mass spec-
trometer for wheat lines evaluated across multiple
years and sites (Fig. 11.6). In both cases the rank-
ings of low and high predicted extremes are con-
sistent with rankings based on actual values.
Remote sensing of multispectral refl ectance
enables rapid assessment of biomass and green
leaf area, canopy architecture (as photosyntheti-
cally active radiation absorption), plant nitrogen,
and water status of large breeding populations
assessed as plots (Babar et al., 2006). Preliminary
indications are that spectral refl ectance indices are
repeatable with high heritability and are corre-
lated with grain yield across contrasting irrigation
regimes (Babar et al., 2006).
Other seemingly less complex tools have
application for high-throughput phenotyping in
breeding programs. Use of digital cameras and
availability of free or inexpensive digitizing soft-
ware can be used for rapid assessment of vegeta-
tion indices, ground cover, or plant establishment
counts for large numbers of lines (Casadesús et
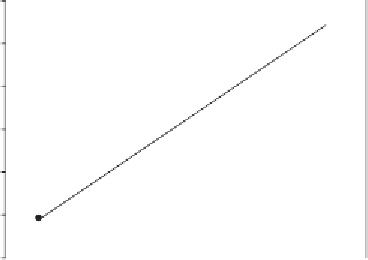
al., 2007). Similarly, Fig. 11.7 illustrates how
image analysis of scanned harvest grain can be
used to provide indirect estimates of kernel size
for a population of 191 genotypes evaluated under
drought. Three-hundred seed were scanned at
low resolution (300 dpi) for each genotype, and
area per kernel was nondestructively determined
to provide an estimate of the mean, range,
and variance for kernel size of each genotype
sample.
Plant water status can be readily assessed from
canopy temperatures using handheld, infrared
thermometers (Olivares-Villegas et al., 2007) or
through stomatal conductance values from
viscous-fl ow porometers (Rebetzke et al., 2001b;
Kirkegaard et al., 2007). Thermal imaging and
the availability of infrared cameras provide good
resolution around leaf temperatures (Chaerle et
al., 2007). Indirect estimates of photosynthetic
capacity may be obtained through leaf nitrogen or
chlorophyll content from a soil-plant analytical
development (SPAD) chlorophyll meter and
together with measures of stomatal conductance
may provide indirect measures of transpiration
effi ciency.
Despite the success in trait identifi cation for
implementation in breeding, there are few docu-
mented successes where physiological traits have
been integrated into wheat breeding programs. A
number of factors may be limiting adoption, with
55
22
50
45
21
40
20
35
19
30
18
25
11
12
13
14
15
16
17
18
19
17
Kernel area (mm
2
)
17
18
19
20
21
22
Fig. 11.7
Relationship of kernel area and kernel weight for
191 doubled-haploid progeny from the Sunco/Tasman
mapping population. Kernel area was determined from
approximately 300 harvested seed (per line) scanned into a
single image using a fl atbed scanner. The area was deter-
mined using AnalySis image analysis software (Y
Measured CID (‰)
Fig. 11.6
Plot of carbon isotope discrimination (CID) mea-
sured on wheat leaves for three cultivars assessed across a
range of nitrogen treatments, sites, and plant densities against
CID predicted using a NIR calibration (Y
=
1.3
+
0.93X,
=
−
12
+
3.6X,
r
2
r
2
=
0.93).
=
0.84).