Agriculture Reference
In-Depth Information
conserving subsoil moisture for the major yield-
determining phases of crop growth toward the
end of the season. Yet dryland farmers also desire
wheat cultivars that perform well in wetter years
(yields of 3-5 t ha
−1
), because this is where profi ts
are maximized. However, due to interannual
variation in rainfall, breeders cannot reliably
sample the range of on-farm environments in
each year. Hence, it is of value to describe the
nature of environments experienced over the
long term, and consider how well these are
sampled.
Long-term weather records (116 years, to 2006)
for fi ve locations representing the northern Aus-
tralian wheat region were analyzed by Chapman
(2008) to calculate a weekly water demand—
supply (or stress) index, whereby a lower score
equates to greater stress. The simulations encom-
passed several management regimes and planting
dates for each part of the region. To focus on the
key growth periods for sensitivity to stress, the
index was centered at fl owering and extended 450
degree-days (base temperature of 0 ºC) before and
after fl owering. The stress indices were then sum-
marized by cluster analysis to produce fi ve
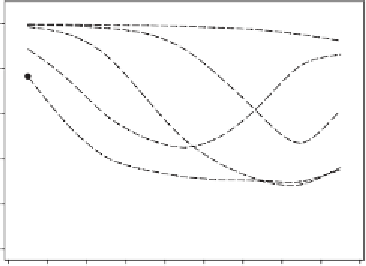
drought stress patterns (Fig. 11.3). The major
patterns identifi ed were mild or no stress (no. 5,
22% of location-season combinations), prefl ow-
ering stress (no. 2, 25%), and terminal stress
[53%; beginning either around fl owering
(no. 4, 29%), booting (no. 3, 10%), or prior to
booting (no. 1, 14%)]. The occurrence of pre-
fl owering drought was greater in the more north-
ern locations, while postfl owering drought was
greatest in the most southerly locations of the
region.
There have been some efforts to extend the
concept of environmental characterization to
breeding so as to understand change in genotype
ranking with changing water supply. For example,
Cooper et al. (1997) used performance for a
common set of wheat genotypes to characterize
environments, some of which included full or
supplementary irrigation. Chapman (2008)
extended the concept of a stress index for a data
set of 18 genotypes evaluated in 12 years at 22
locations. Fifty-eight percent of the trials experi-
enced a mild degree of water stress from just
before fl owering to mid-grain fi ll (ET1). A mod-
erate to severe water stress in the period prior to
fl owering and through grain fi lling (ET2) occurred
in the remaining 42% of trials. Without classifi ca-
tion for environment type, the genotype × envi-
ronment interaction variance was substantially
larger than the genotypic variance (Table 11.1) to
reduce heritability for yield and slow potential
genetic advance. When classifi cation of environ-
ment type was included in the analysis, the geno-
typic variance in the mild-stress environments
(ET1) was estimated at three times the size of the
genotypic variance within the moderate-stress
environments (ET2). Examination of the data
showed that predominantly later-fl owering geno-
types accounted for the genotype × environment
1.0
0.8
0.6
0.4
Table 11.1
Genotype and genotype
environment analy-
ses of yield in 76 wheat trials and for trials classifi ed within
two drought environment types (after Chapman 2008).
×
Env 1
Env 2
Env 3
Env 4
Env 5
0.2
0.0
Variance
Component
Standard
Error
Source
-450
-350
-250
-150
-50
50
150
250
350
450
Thermal time before and after anthesis (°C d)
Genotype
0.083
0.027
Genotype
×
environment
0.120
0.007
Fig. 11.3
Seasonal drought stress patterns derived from the
APSIM-wheat cropping simulation model in 6 locations and
116 years for the northern wheat region of Australia. See text
for description and frequency of occurrence of the drought
stress patterns.
Genotypes within ET1
0.142
0.047
Genotypes within ET2
0.038
0.014
Genotype
×
ET group
0.115
0.006
Residual variance
0.096