Information Technology Reference
In-Depth Information
Table 2. Percentages from total benefits
KPIs
Forecasted situation
Real situation
Percentage of incidents resolved without breaching one
N/A
49,07%
Percentage of incidents resolved within target time by priority
0,00%
N/A
Percentage of incidents re-assigned
0,13%
0,29%
Percentage of incidents incorrectly categorized
0,00%
0,00%
Percentage of calls 1st line support bypassed
3,22%
40,22%
Incident management process maturity
0,00%
0,01%
Number of incidents
93,31%
N/A
Percentage of incidents resolved by 1st line support
0,16%
1,03%
Average call time with no escalation (minutes)
0,02%
0,46%
Percentage of incidents incorrectly assigned
0,04%
0,11%
Average time for 2nd level support to respond (minutes)
1,29%
1,71%
Average time to resolve incidents (minutes)
0,27%
2,28%
Percentage of calls that are service requests
0,47%
3,42%
Percentage of incidents solved rightly the first time
0,02%
0,03%
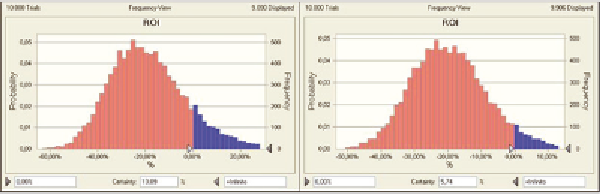
overall investment is € 500.000, which means
that the ROI mean value is -20%. The purpose
of this simulation is to realize if the correlations
that exist between processes pay off the superior
project's investment costs or not.
benefits. In contrast, the simulation with real
data confirmed the existence of two high-impact
KPIs, “percentage of incidents resolved without
breaching one SLA” and “percentage of calls 1st
line support bypassed”, with 49,07% and 40,22%,
respectively.
Therefore, some of the other KPIs proved to
be irrelevant, but those KPIs whose percentages
are linearly dependent on the “percentage of time
that impacts employee productivity” could have
more impact on the final result, if this percentage
was set to a higher value.
So, the KPI “number of incidents” unlever-
aged the results of both simulations. In fact, the
estimated value for this KPI is the outcome of a
results
Incident Management
Process Simulation
According to table 2, the KPI “number of in-
cidents” has a devastating influence over the
benefits quantification outcome in the simulation
with estimated data with 93,31% of the monetary
Figure 5. ROI Monte Carlo simulation with (left) and without (right) correlations


Search WWH ::

Custom Search