Information Technology Reference
In-Depth Information
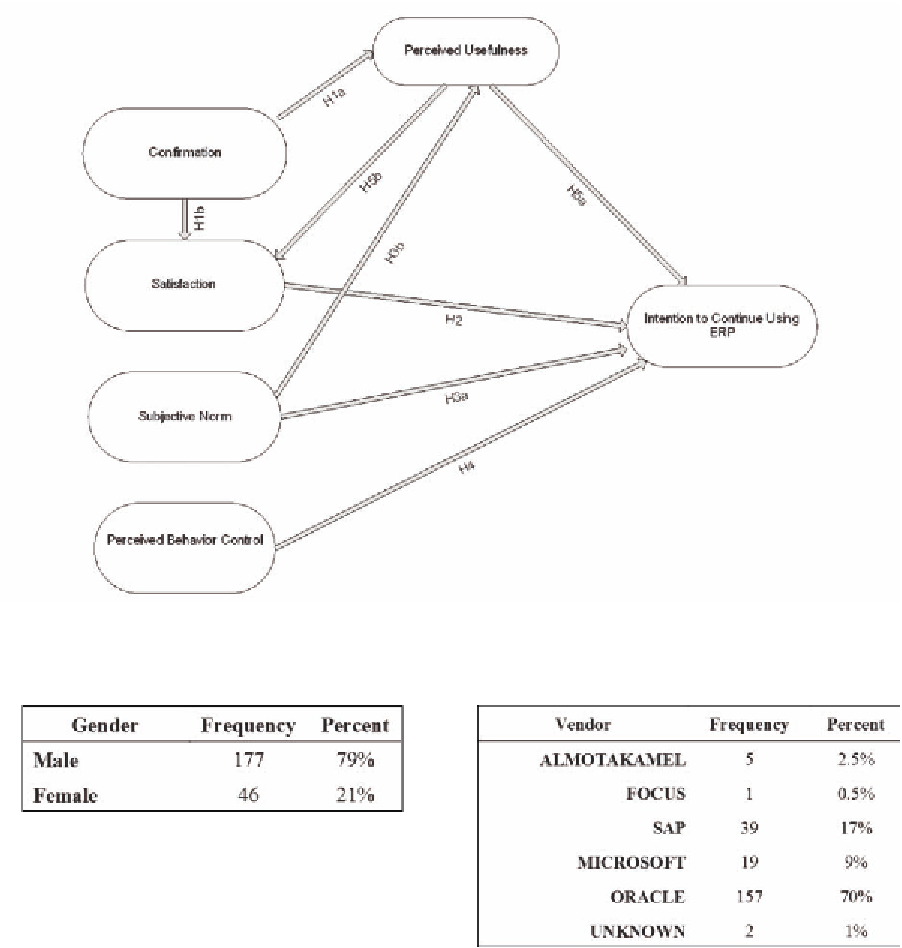
Figure 1. The research model
Figure 3. ERP systems
Figure 2. Gender distribution
and backgrounds. Results indicating industry and
its frequency are presented in (Figure 4).
In (Figure 5), respondents function is presented
together with its frequency and percentage of oc-
currence. Again, the respondents belong to quite
different backgrounds.
the instrument is 0.89. All measures show ac-
ceptable reliability exceeding the cutoff value
of 0.7 (Elsawah et al., 2008). Acronyms used
to refer to survey measures as follows: (CONF:
confirmation, P_USEF: perceived usefulness,
SN: subjective norm, PBC: perceived behavior
survey Validation
To test the research instrument reliability Cron-
bach Alpha was used. The overall reliability of
Search WWH ::

Custom Search