Environmental Engineering Reference
In-Depth Information
6
5
4
3
2
1
0
2000
2020
2040
2060
2080
2100
Year
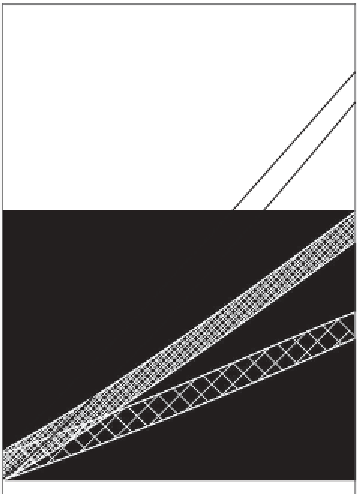
fig. 5.2
Temperature change estimates including random
fluctuations. For scenario A
the bands represent the upper end of the
range, the average of the models, and the lower end of the range
broadened into bands by the random jumps of
C around
the trend lines. Where the temperature change is headed cannot be
accurately determined until the bands begin to separate.
That will take about
.
more years.
centered on the upper end of the range, the average of
the models, and the lower end of the range. Each band
is
C wide to represent the climate
s random jumps
around the trend lines. You cannot really tell where the
temperature change is headed other than that it is
headed up, until the bands begin to separate. What has
.
'