Environmental Engineering Reference
In-Depth Information
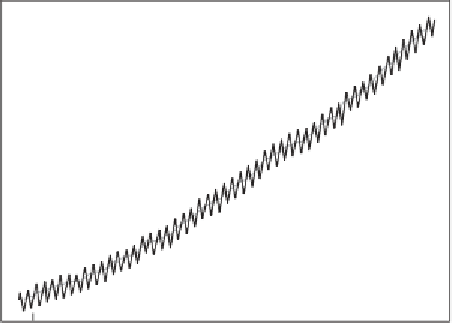
390
370
350
330
310
1960
1970
1980
1990
2000
2010
Year
Data from the observatory at Mauna Loa, Hawaii.
Atmospheric CO
concentration versus year, including Keeling
fig. 3.1
s and
more recent observations. (Source: Pieter Tans, NOAA Earth System
Research Laboratory, Boulder, CO, and Ralph Keeling, Scripps
Institution of Oceanography, UC San Diego, La Jolla, CA)
'
Revelle because of his interest in measuring atmospheric
CO
) began publishing his measurements of the amount
of atmospheric CO
in the late
s data were
taken at an observatory built on a mountain in Hawaii,
and showed a small saw-toothed oscillation in the amount
of CO
in the atmosphere superposed on a generally
upward trend.
For the
s. Keeling
'
first few years, the saw-toothed oscillations,
caused by seasonal variations, prompted considerable
excitement. After several years, however, the big news
turned out to be the long-term upward trend in concen-
]. This was
no tiny effect, but a major change in one of the important
.
)[