Environmental Engineering Reference
In-Depth Information
5
100
4
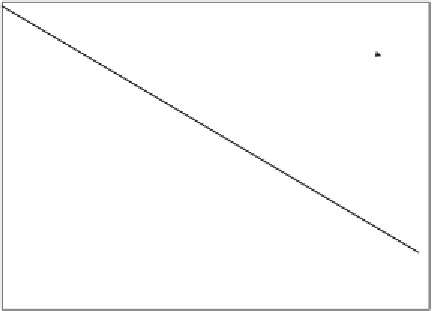
-0.94%/yr
Fuel Price
3
2
1
0
Energy Intensity:
Traditional +
Commercial Fuels
-2.7%/yr
Energy Intensity:
Commercial Fuels Only
10
1800
1850
1900
Ye a r
1950
2000
gure
for energy intensity versus time includes what happened to fuel
prices in the
fig. 11.1
Energy intensity versus time. This version of the
s. It shows the coupling between a price
shock and a move toward higher ef
s and
ciency and, hence, lower energy
intensity. (Courtesy of Prof. S. Fetter, University of Maryland.
© Steve Fetter, Climate Change and the Transformation of
World Energy Supply, Stanford: Center for International
Security and Cooperation,
)
of the overall long-term decline in energy intensity, a meas-
ure of the ef
ciency with which energy is used in society.
This time I use a version of the
figure that includes what
happened to fuel prices. The high price of oil stimulated
a move to ef
ciency, and energy intensity dropped much
faster in the
sand
s than the historical average.
What was a decline of
%peryear
during the period of what was called the oil shock.
The
% per year became
.
first Corporate Average Fuel Economy (CAFE)
standards (see
Technical Note
.
for the de
nition) were
introduced in the United States in
as a result of the