Environmental Engineering Reference
In-Depth Information
20
15
10
5
0
-
2000
2060
2120
2180
2240
2300
Year
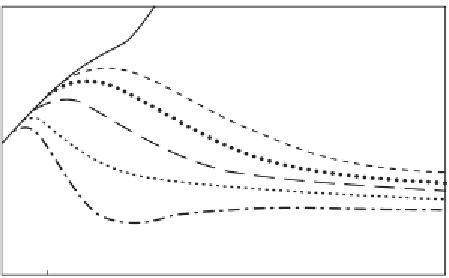
BAU
750 ppmv
650 ppmv
550 ppmv
450 ppmv
350 ppmv
Stabilization trajectories. Carbon emissions allowed if the
atmosphere is to be stabilized at one of several new levels. Also shown
is the BAU expectation. (Courtesy of Professor John Holdren,
Harvard University)
fig. 6.3
I confess that there is no calculation that tells me it is
the correct limit.
Figure
shows examples of what are called stabiliza-
tion trajectories. Also shown is the business-as-usual tra-
jectory. (Note that this chart has emissions in terms of
billions of tonnes of carbon; to get it in CO
.
terms,
multiply the carbon emissions by
.) A stabilization tra-
jectory shows the allowed world greenhouse gas emissions
versus time that will stabilize CO
at various levels. The
.
The US Climate Change Science Program has recently released a report
on abrupt climate change. It can be found at
http://www.climatescience.
gov/Library/sap/sap
-
/default.php.