Information Technology Reference
In-Depth Information
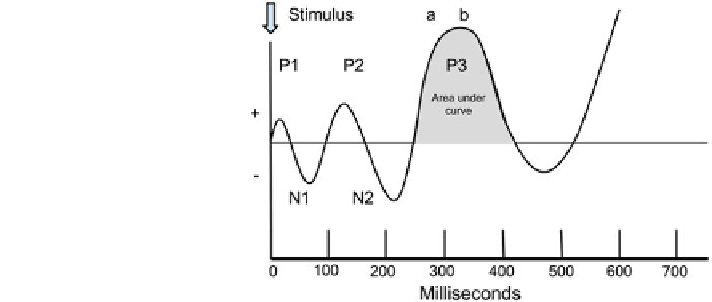
indicates the event is unpredictable in comparison to surrounding events, with the
strength of the N100 component being roughly related to how random/unexpected
the sensory event appears to the user. The N1 is often accompanied by the P2 or
P200, which is a positive going response peaking at around 200 ms. Both these
components are usually considered lower in amplitude and therefore slightly harder
to detect than the P3, or P300, a positive-going potential, peaking at around 300 ms.
It is thought that this component represents the moment at which an external event,
being suitably unpredictable, causes a sensory signal considered important enough
to cause a shift in attention in the brain. Basically, it is the point at which you
consciously notice something happening
something out of the ordinary. As has
already been stated, this component has a tendency to be higher in amplitude than
many other parts of the raw EEG signal. Therefore it can sometimes be seen in the
raw data signal as a peak. However, there are also other peaks in the signal, which
makes detection complex (Fig.
3.1
).
Importantly, the P300 is thought to consist of two potentials that interrelate: the
P3a and P3b. The difference between them is key. The P3a is often called the
“
—
response, and is detectable under conditions where you experience a
break in a pattern, or the onset of a new type of event in a stream of other events.
However, the P3b is thought to occur when you intend to notice something in a
stream of events, such as when you are searching for a speci
oddball
”
c target, such as a
certain picture or letter.
In order to use the P300 ERP in the design of a BCMI, we will need to elicit the
P300 through the use of unpredictable events (often called
), or by some
form of user-driven search task with rapid presentation of a range of choices. This
requires signi
“
oddballs
”
cant expertise in digital signal processing (DSP) and audiovisual
interaction paradigms, but is achievable by those with appropriate maths and pro-
gramming skills using the basic methods described below and throughout this
chapter.
To make life easier for those researchers who wish to utilise existing ERP
detection software, there are some freely available P300 detection toolkits for
Matlab (such as EEGLAB
http://sccn.ucsd.edu/eeglab/
)
, and also excellent alter-
native frameworks such as openVIBE and BCI2000. These toolkits support a range
Fig. 3.1
A graph of common
event related potential
components following a
stimulus. Note the inclusion
of approximate timings for
P3a and P3b, and the
indication of the positive area
underneath the P300 curve