Information Technology Reference
In-Depth Information
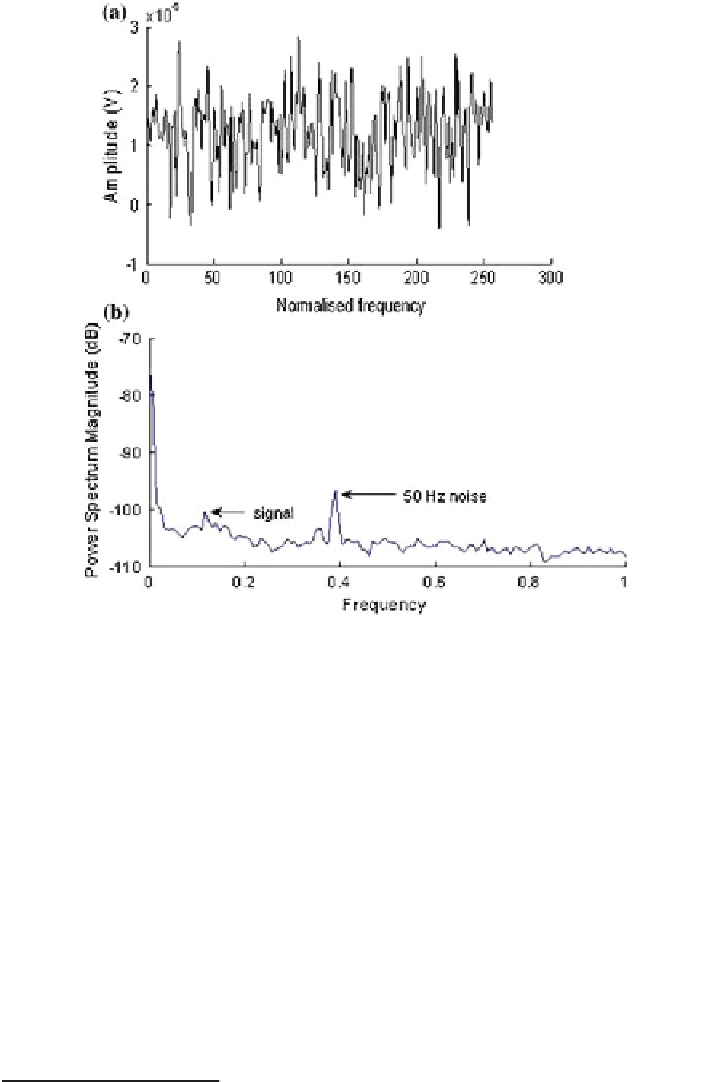
Fig. 2.5
a
example of recorded EEG and
b
power spectral density of EEG showing signal and
noise frequencies
ed and converted to
digital using an analog-to-digital converter. The digital conversion using sampling
rates such as 256 Hz
1
is necessary to process the EEG signal using digital devices
(like computers).
The EEG is normally obtained using certain BCI paradigms (to be discussed
later), and the
As the EEG is of very small amplitude, it is normally ampli
first-processing step is to reduce noise such as muscle artefacts,
power line interference and other random noises from the EEG signals. Frequency-
speci
filter the noise from
the EEG; recently more sophisticated methods such as principal component anal-
ysis (PCA) and independent component analysis (ICA) have been employed.
Figure
2.5
a shows an example of the recorded EEG (using the SSVEP BCI para-
digm) corrupted with power line interference. It can be seen the occurrence of this
50 Hz noise along with the signal frequency in the power spectral density plot of the
c
filtering using digital
filters is commonly employed to
1
With 256 Hz sampling rate, one second EEG will have 256 data points, other sampling rate up to
2,048 Hz is common.