Information Technology Reference
In-Depth Information
Table 10.1
The montage of
14 electrodes used in EEG
melodies
Electrode number
Electrode name
1
Fp1
2
Fp2
3
F7
4
F5
5
F4
6
F8
7
T3
8
T4
9
T5
10
P3
11
P4
12
T6
13
O1
14
O2
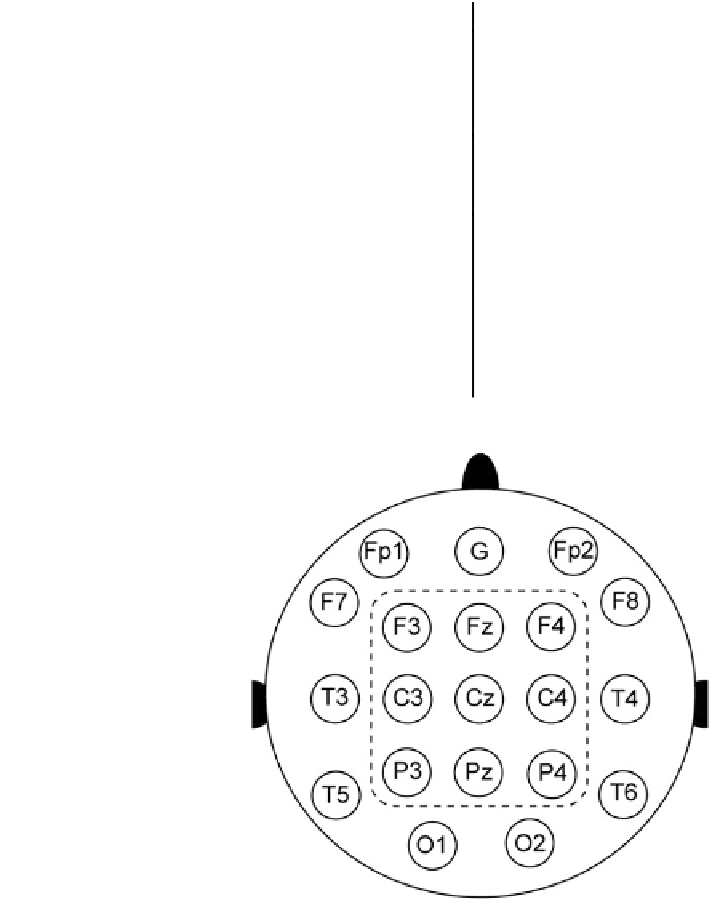
Fig. 10.2
The 10
20
electrode placement scheme
recommended by the
International Federation of
Societies for EEG and clinical
neurophysiology
-
of each individual electrode was analysed individually in order to infer possible
trajectories of speci
c types of EEG information across a montage of 14 electrodes,
as listed in Table
10.1
; see Fig.
10.2
for placement scheme with labels suggested by
the International Federation of Societies for EEG and Clinical Neurophysiology.
As an example, let us assume that we are interested in tracking the behaviour of
the overall EEG amplitude. Figure
10.3
plots the amplitude of the EEG on each
electrode for approximately 190 s. Each plot
is divided into 5 windows of
approximately 38 s each;
the size of this window is arbitrary. The average