Information Technology Reference
In-Depth Information
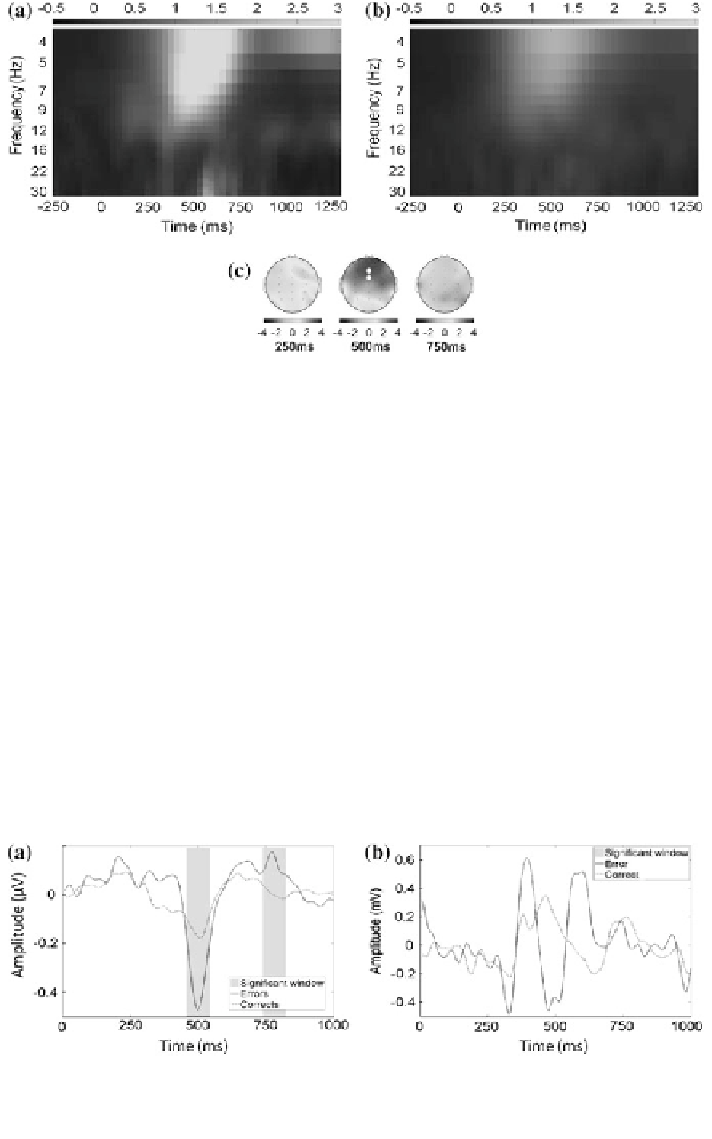
Fig. 8.4
Grand-average (
N
= 19) ERS averaged at electrodes (Fz, FCz, Cz, CPz) for error a and
correct b trials. c Topographic maps of t values averaged over the theta band and time window
[350 ms 600 ms]. White disks show the signi
cant clustered electrodes
8.9.3 Source Analysis
BSS analysis revealed two uncorrelated sources with variable sensitivity and
speci
city, however, clearly responsible one for the ERP
findings and one for the
ERS
findings. The source responsible for the ERP differences between error and
correct trials, to which hereafter we will refer to as the
“
Ne source,
”
was signifi-
-
cantly different in error versus correct trials in two time windows, with a
rst
negative peak at time window [460 ms 540 ms] (
p
< 0.01) and a positive peak at
time [750 ms 830 ms] (
p
= 0.015). The grand-average ERP of this source computed
separately for error and correct trials is displayed in Fig.
8.5
a. In Fig.
8.5
b, it is
displayed the same grand-average ERP when computed using the spatial
filter of the
source responsible for the ERS differences between error and correct trials, to which
Fig. 8.5
Grand average (
N
= 19) of the ERP generated by the Ne source a and by the theta source
b for error (
solid line
) and correct (
pointed line
) trials. Time windows where the difference in
amplitude between the two conditions is signi
cant are highlighted by
gray panels