Information Technology Reference
In-Depth Information
10
4
2
5
0
2
0
4
5
4
2
4
2
0
10
0
2
4
2
4
10
5
0
5
10
(a)
(b)
10
10
5
5
0
0
5
5
10
10
10
5
0
5
10
10
5
0
5
10
(c)
(d)
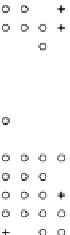
Fig. 2.5
The domain of attraction for rigid body rotations: (a) the volume representing the
domain of attraction with nearby points where
V
>
0; (b) the slice through the level sets of
V
through the origin and aligned with the θ
1
axis; (c) the slice aligned with the θ
2
axis; and (d)
the slice aligned with the θ
3
axis. The + symbols indicate locations at which
V
≥
0andthe
◦
symbols indicate locations where
V
<
0
initial displacement of the robot to be near the empirically determined limits of the
domain of attraction, except for the case of the rigid body rotations as discussed
later. Error measurements were computed using the forward kinematics of the robot
to determine the goal pose of the robot, the initial displacement, and the final pose
of the robot.
Figure 2.7 shows the camera trajectories of the robot in the (
x
y
) plane for the 50
experimental trials of 2D motion parallel to the image plane. The statistics concern-
ing average error, standard deviation of error, and maximum and minimum errors
is given in Table 2.1. A point of interest is the minimum final error of 90 microns.
,


Search WWH ::

Custom Search