Information Technology Reference
In-Depth Information
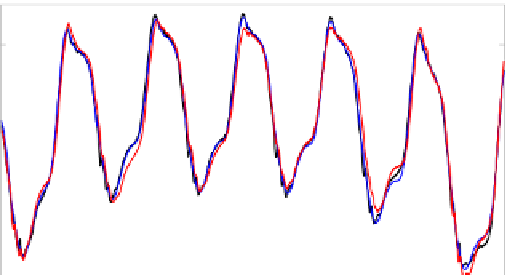
Zoom in the spectral analysis
0.018
0.016
f
c
0.014
6f
r
f
c
−f
r
5f
r
0.012
f
c
+f
r
0.01
0.008
0.006
0.004
0.002
1.2
1.3
1.4
1.5
1.6
1.7
1.8
frequency (Hz)
Fig. 6.5
A zoom in a spectral analysis of the heart motion
fundamental frequency than
M
r
but is different in amplitude and has a more limited
bandwidth. Note that
C
c
(
k
) ensures the presence of the carrier in the modulated
signal to fit the spectrum in Figure 6.5 (peak at
f
c
Hz).
The equation above can be written after a linearization as
T
(
k
)
W
(k)
M
(
k
)=
Φ
,
(6.7)
T
(
k
) is the parameters vector that can be identified and updated online and
W
(k) is a regressor vector depending only on the current cardiac and respiratory
states. As the future cardiac and respiratory states can be known in advance, future
motion at sample
k
+
n
can be simply computed as
where
Φ
T
(
k
+
n
)
W
(k)
M
(
k
+
n
)=
Φ
.
(6.8)
Anterior Posterior direction
signal
AM
LPV
0.2
0.1
0
−0.1
−0.2
−0.3
0
0.5
1
1.5
2
2.5
3
3.5
time (sec)
Fig. 6.6
One heartbeat period ahead prediction


Search WWH ::

Custom Search