Java Reference
In-Depth Information
That is quite a spike for three lines of code. This job went from barely using the CPU at all to pushing
it to 50% utilized for that step. But if you didn't know what caused that spike, where would you look
next?
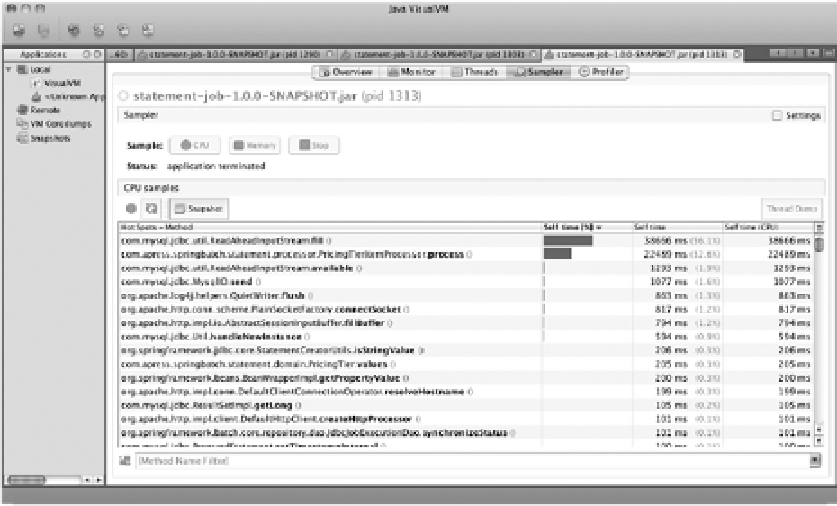
With a spike identified like this, the next place to look is in the Sampler tab. By rerunning the job
under the same conditions, you can see what individual methods show up as hot spots in the job's
execution. In this case, after you begin running the job, the method that stands out immediately is
com.mysql.jdbc.util.ReadAheadInputStream.fill()
. This class is used by the MySQL driver to read from
your database. As you saw previously, I/O is typically the main bottleneck for processing in today's
business systems, so seeing this class take up the majority of the CPU should come as no surprise.
However, at the same time that the spike on the Monitor tab begins, a new class quickly climbs through
the ranks of the list of methods using a lot of CPU:
com.apress.springbatch.statement.processor.PricingTierItemProcessor.process()
. By the end of the
job, this method has taken up 32.6% of all the CPU time required to execute this job, as shown in Figure
11-9.
Figure 11-9.
The
PricingTierItemProcessor
has taken up quite a bit of CPU.
When you come across a scenario like this, a better way to view what is eating up CPU execution
time is to filter the list by the package name you're using for your code. In this case, you can filter the list
on
com.apress.springbatch.statement
to see what classes take up what percentage of the total CPU
utilization. Under this filter, the culprit becomes crystal clear in this example: the
PricingTierItemProcessor.process() method and the 32.6% of the CPU time it takes up.
. The next
highest on the list takes up 0.3% (
com.apress.springbatch.statement.domain.PricingTier.values()
). At
this point, you have all the information you can get from the tool, and it's time to begin digging through
the code to determine what in
PricingTierItemProcessor.process()
is using so much CPU.
Simple, isn't it? Not really. Although the process used here is what you would use to narrow down an
issue in any system, the issue is rarely this easy to track down. However, using VisualVM you can
progressively narrow down where the issue is in your job. CPU utilization isn't the only piece of
performance. The next section looks at how to profile memory using VisualVM.