Java Reference
In-Depth Information
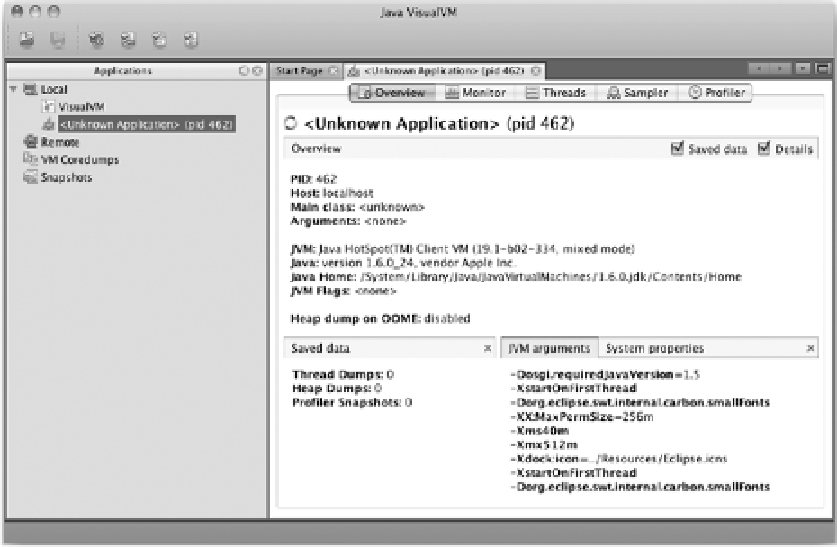
Figure 11-2.
Connecting to a Java Process
Along the top of the screen are five tabs:
•
Overview:
Provides an overview of the Java application running, including the
main class, application name, process id, and arguments passed into the JVM on
startup.
•
Monitor:
Displays charts showing CPU utilization, memory utilization (both heap
and PermGen), the number of classes loaded, and the number of live and daemon
threads. The Monitor tab also lets you perform garbage collection as well as
generate a heap dump for later analysis.
•
Threads:
Displays information about all threads the application has launched and
what they're doing (running, sleeping, waiting, or monitoring). This data is shown
in either timeline, table, or detail form.
•
Sampler:
Allows you to take a sample of the CPU utilization and memory
allocation for your application as well as take snapshots. CPU shows what
methods are taking how long to run. Memory utilization shows what classes are
taking how much memory.
•
Profiler:
Looks and feels similar to the Sampler tab, but lets you profile the CPU
and memory utilization as well as save snapshots of the current state each of these
two resources is currently in. You can also compare multiple snapshots.
In addition to the tabs, Overview shows you information about the current Java process that is being
analyzed including process id, the host the process is running on, JVM arguments, as well as the full list
of system properties the JVM knows.