Java Reference
In-Depth Information
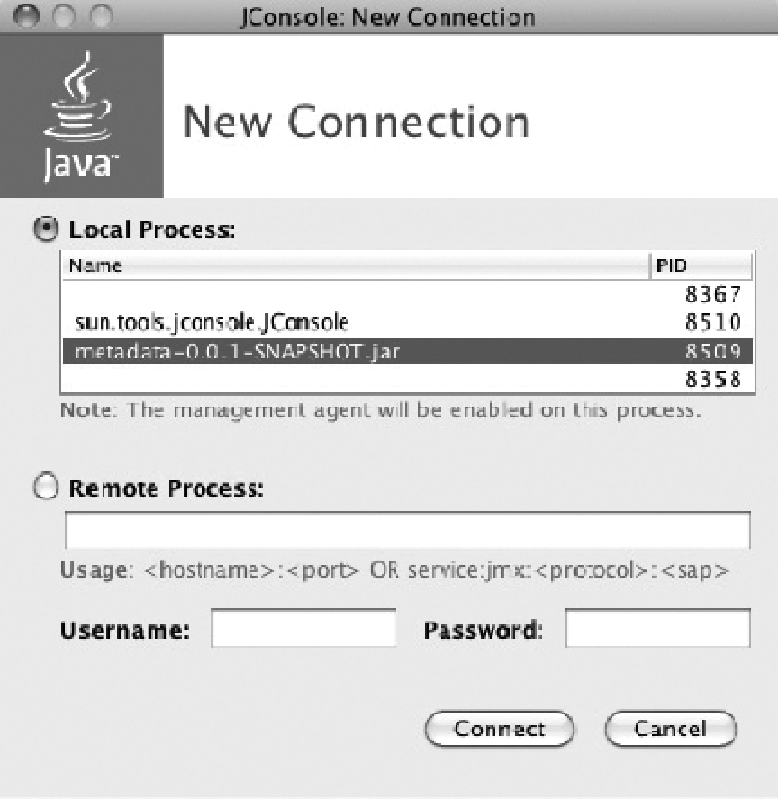
Figure 5-2.
The JConsole main screen
In this case, select the local process (you can use JConsole to administer remote Java processes as
well) with the name
org.codehaus.classworlds.Launcher "exec:java"
. This is the Java process you
launched with the
maven
command in Listing 5-15. Clicking connect allows JConsole to connect to the
JVM.
After you connect, JConsole shows you a screen like the one in Figure 5-3. At the top are six tabs:
Overview, Memory, Threads, Classes, VM Summary, and MBeans. Below the tabs, JConsole lets you
select the time range for which to display the overview data. Finally, there are four quadrants of data: the
amount of JVM heap memory usage, the number of threads being used, the number of classes currently
loaded by the JVM, and the CPU usage during the time selected. The tab you're interested in is MBeans.