Information Technology Reference
In-Depth Information
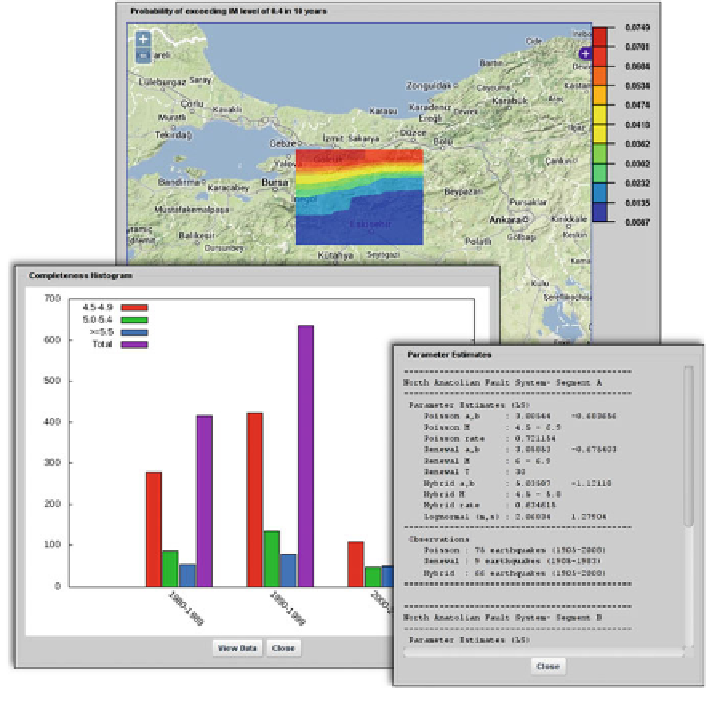
Fig. 12.4 Sample textual and graphical outputs examined through portlet interface
In all the portlets, the users can download the produced results, which are
bundled as an archive
file, and view the
execution log,
which contains informational
status messages, warnings, and errors produced by the corresponding workflows.
The users are additionally provided with the chance to directly examine the outputs,
produced by corresponding workflows, through the portlets. Figure
12.4
depicts
three examples of such outputs: probability map, showing the probabilities that
seismic events exceeding the speci
ed time interval
may occur in the site region, produced by SSF4 workflow is shown at the top. At
the bottom-left a completeness histogram is shown, which illustrates the distribu-
tion of the earthquakes in the integrated catalog among time and magnitude
intervals, produced by SSF1 workflow. Finally, a textual output window, con-
taining parameter values estimated by SSF2 workflow for a set of seismic sources,
is depicted at the bottom-right.
ed intensity level in the speci
Search WWH ::

Custom Search