Biology Reference
In-Depth Information
1988; Gunning
et al
., 1994; Kedes
et al
., 1985; Ng
et al
., 1985; Ponte
et al
., 1993).
The actin genes are highly conserved evolutionarily and encode protein isoforms
that differ from each other by only a few amino acids, mostly at their amino ter-
minals. Those characterized in human are
-smooth muscle aortic actin (
ACTA2
;
10q22-q24),
-skeletal actin (
ACTA1
; 1q42.1),
-cardiac actin (
ACTC
; 15q14),
-
nonmuscle cytoplasmic (
ACTB
; 7p12-p15),
-nonmuscle cytoplasmic (
ACTG1
;
17q25) and
-smooth muscle enteric (
ACTG2
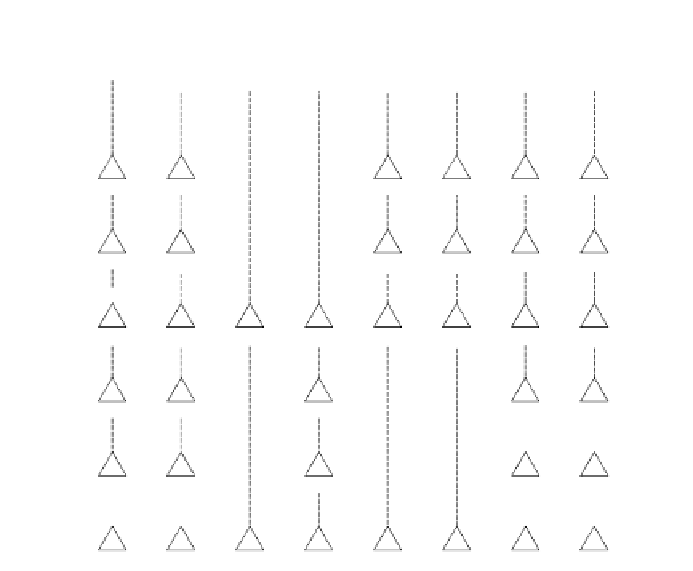
; 2p13.1) actins. Comparison of the
structures of these six human actin genes (
Figure 4.3
) indicates that comparable
regions are identically interrupted by introns although the sizes of the introns dif-
fer (Miwa
et al
., 1991). Comparison of nucleotide and amino acid sequences as well
as gene structures also allowed Miwa
et al
. (1991) to propose a possible phyloge-
netic tree for the actin gene family (
Figure 4.4
). Since all four muscle actins differ
from the cytoplasmic actins by substitutions at 19 amino acid residues, the mus-
cle actins must have shared a common ancestral actin gene. Duplication and
divergence then led to the emergence of the smooth muscle and striated muscle
actin genes. Introns were gained or lost at different stages in this process. The
ancestral smooth muscle actin gene acquired an amino acid substitution at
residue 89 before being duplicated; the smooth muscle
-actin subsequently lost
an amino acid residue at position 4.
1
2
3
4
5
6
7
8
Intron site
41/
42
84/
85
121/
122
327/
328
5' UTR
150
204
267
374aa
91
12
252
ACTA1
869
106
127
79
56
78
44
23
181
ACTC
670
[1.0]
670
126
[0.6]
[0.5]
42
23
147
ACTA2
3771
[1.4]
[3.4]
[1.9]
[0.4]
[1.4]
[1.3]
[2.6]
78
6
592
ACTB
832
134
441
95
112
68
6
721
ACTG1
373
89
277
79
93
44
36
77
ACTG2
[7.5]
880
[6.4]
269
[4.3]
[1.0]
[2.5]
[3.5]
Figure 4.3.
Comparison of gene structures of the six human actin genes (after Miwa
et al
.,
1991). Triangles indicate intron positions. The numbers below indicate intron sizes in
base-pairs or kilobases (in square brackets). The numbers above the lines indicate the
sizes of the 5
UTR in exons 1 and 2 and those of the 3
UTR in the last exon.