Geoscience Reference
In-Depth Information
Following international practice, EDR values are classified into four categories in terms of
the intensity of turbulence. For convenience and in line with alerting purpose of low-level
turbulence, EDRs in the following figures and context will be labeled or indicated as
insignificant (LL), light (L), moderate (M), and severe (S) instead of its value. It is also worth
mentioning that EDR values presented in this paper are derived from the spectrum width
data after smoothing by using a 9 point median filter along the radar beams in order to
suppress the fluctuations in the determination of spectrum width values. This kind of
fluctuation is expected, for instance, to arise from the limited and finite number of data
points in the digitization of the spectrum of the return signal.
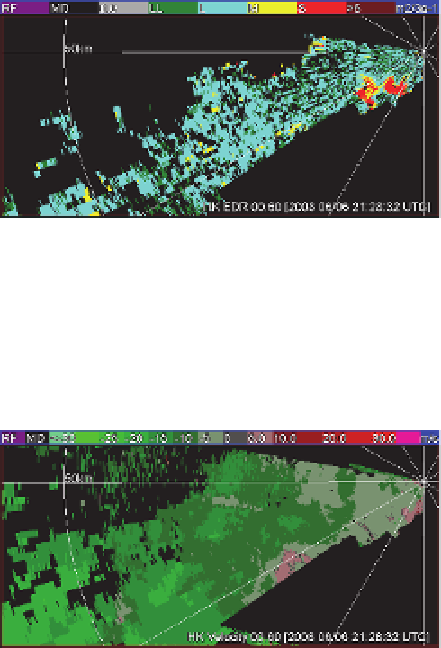
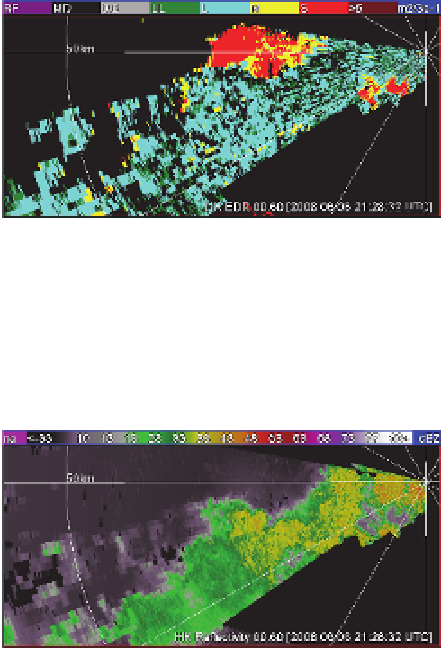
The spectrum width errors are large in region of low SNR. Here we selected a case to
demonstrate the importance of the SNR threshold in the quality control of EDR data. Around
21 UTC on 6 June 2008, the TDWR radar observed thunderstorms over HKIA. Without SNR
threshold, estimated EDR suggested severe turbulence region (red color; Figure 9(a)) in the
region about azimuth of 270
o
and centered at about 25 km. High spectrum widths (~4.5 m/s)
are indeed measured in this region (see Figure 9(c)). But reflectivity (Figure 9(e)) and SNR
(Figure 9(d)) are around -8 dBZ and 10 dB respectively. The relatively large spectrum widths
in this region can be caused by incorrect noise power estimates (Fang et al., 2004). To avoid
such biases, we use a SNR threshold of 20 dB as recommended by Fang et al., (2004).
Fig. 9. (a) EDR, (b) EDR with SNR> 20 dB, (c) spectrum width, (d) SNR, (e) reflectivity, and
(f) Doppler velocity at elevation angle of 0.6
o
at 21:28 UTC on 6 June 2008. Range ring is 50
km and azimuths are every 30
o
.