Geoscience Reference
In-Depth Information
closer to the ground level (about 260 m above mean sea level at the location of the
microburst) in a short time interval within 3 minutes, with the maximum value of towards-
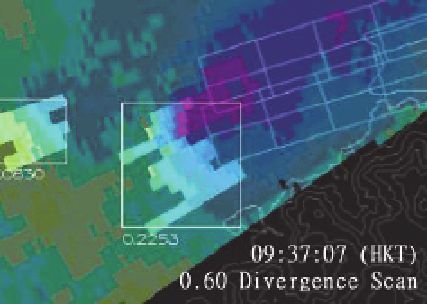
the-radar velocity increasing from 18 m/s (dark blue in Figure 7) to 23 m/s (magenta in
Figure 7). As a result, the F-factor increases in magnitude from 0.14 to 0.23, which exceeds
the must alert threshold. The TDWR-based F-factor provides a good indication about the
level of hazard associated with an evolving microburst.
Fig. 7. Time series of the divergence feature associated with a microburst on 8 June 2007.
The feature is highlighted in lighter colour and enclosed in a box. The number next to the
box is the F-factor calculated for the feature. The background is the radial velocity from the
TDWR, with the colour scale given in Figure 6.
Besides intense convective weather, the windshear hazard in terrain-disrupted airflow is
also studied. The Typhoon Prapiroon case on 3 August 2006 is considered. On that day,
Prapiroon was located at about 200 km to the southwest of Hong Kong over the South China
Sea and tracked northwest towards the western coast of southern China. This typhoon
brought about gale-force east to southeasterly airflow to Hong Kong. Due to complex
terrain to the south of the airport, airflow disturbances occurred inside and around HKIA.
Divergent flow features were observed near the airport from time to time. Figure 8(a)
shows such a feature at 0.6-degree conical scan of the TDWR at about 4:47 a.m., 3 August.
The F-factor associated with this feature is about 0.22, which exceeds the must alert
threshold for windshear. An aircraft landed at the north runway of HKIA from the west at
about that time (within one minute). The variation of the F-factor determined from QAR