Geoscience Reference
In-Depth Information
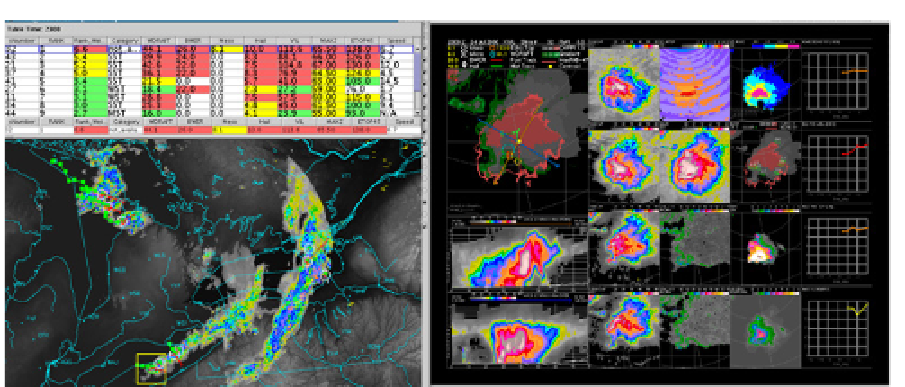
Fig. 9. An example of a CARDS composite, SCIT and cell view. The size of the forecast
domain is about ~2000 km x 1600 km. The image shows a zoomed image of the cells, tracks
and lightning strikes. Eight Canadian radars and 12 US radars contribute to the image. The
composite and the SCIT table products are invoked and displayed at the same time. The
forecaster can either drill down to a CELL VIEW via the composite or via the SCIT table.
They can also rapidly survey the cells from the SCIT table without invoking the CELL VIEW
products. The colour coding indicates the categorical ranking. On the right is an example of
a cell view. This shows a variety of images that allows the forecaster to quickly make a
decision as to the severity of the storm. The product shows an ensemble product of the
algorithms (upper left hand corner, not described), automatically determined cross-sections,
four CAPPIs (1.5, 3.0, 7.0, 9.0 km), reflectivity gradient, MAXR, echo top, VIL density, Hail,
BWER and 45 dBZ echo top and time graphs.
In an envisioned future exercise for the design of CARDS, it was identified that there was
actually no hard requirement for single radar products. One of the main reasons for missed
warnings was that the forecaster was so intent on one thunderstorm that they forgot about
the others. There was a loss of situational awareness. This happens even with experienced
forecasters or analysts and is common in many fields where critical decisions are made. A
regional composite that could display and overlay the most popular products (CAPPI,
EchoTop, etc) is the main product to maintain situational awareness. Thunderstorms cell
locations are identified, ranked, color coded and displayed on the composite and in a table
similar to the SCIT table. Selecting the cell of interest in the composite or in the table, the
user is able to quickly and rapidly drill down to reveal a cell view product (Fig. 9) that
contain all the products that the user would use to interrogate a cell and make decisions.
The cell view has a legacy from Chisholm and Renick (1972). The design exercise also
identified the critical reliance on automated guidance products.
Another important innovation is that the visualization tool for the image and data products
is based on hypertext transfer protocol (http) which means that any computer regardless of
operating system can access the full functionality of the radar data. Analyzing
breakthroughs in the use of radar, access to the data and the products has been “the” key
innovation. Recall the days of radar operators who hand drew radar maps or the facsimile