Geoscience Reference
In-Depth Information
high low level reflectivity core displace towards the updraft
concavity (hook echo)
deviant motion (right or left mover, depending on hemisphere)
rotation
This is a highly condensed version of the technique and there are many subtleties and
morphological pathways as storms evolve. Severe storms begin as non-severe storms and
algorithm developers and forecasters try very hard to extend lead times by trying to identify
the severity of the future storm as early as possible. Note also that it is often in the
collapsing stages of the storm (indicated by collapsing echo top or a descending core) when
the severe weather reaches the surface (see Fig. 4).
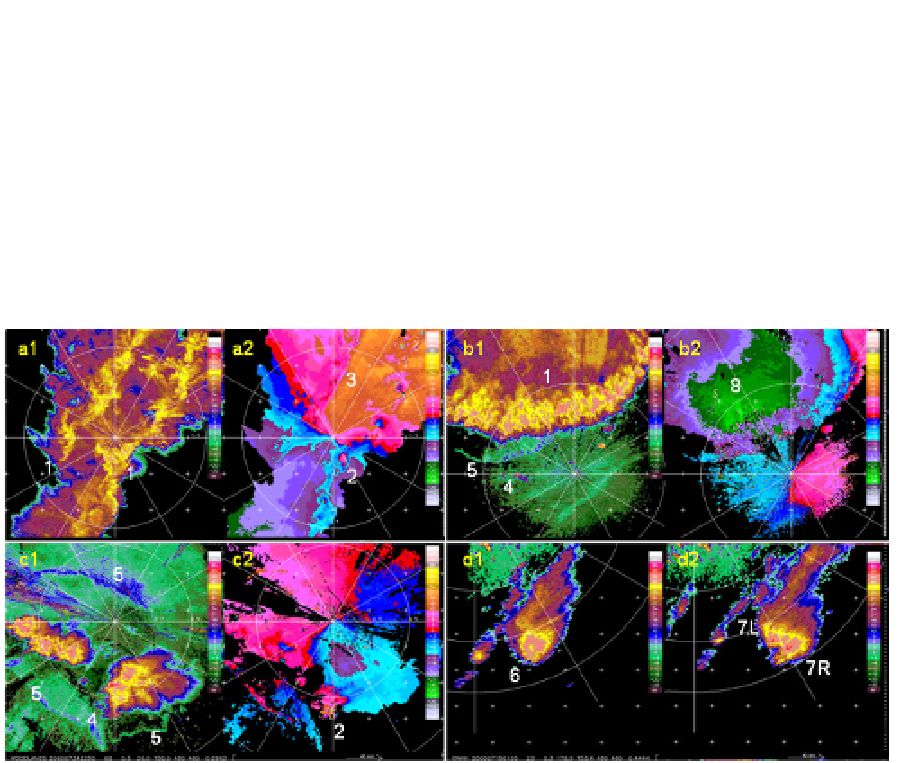
Fig. 3. It is obligatory to show radar images of severe convective storms. Linear convective
storms are show in (a) and (b) whereas isolated thunderstorms are shown in (c) and (d).
Except for (d), reflectivity and radial velocity images are shown together. Fig. 3a shows
double squall lines (1) with embedded cells and mesocyclones (2). (3) shows a shear line
associated with a cold frontal passage, so the mesocyclones are pre-frontal and likely to
have formed on a previously formed outflow boundary. Fig 3b shows embedded
thunderstorms on a bow echo. Note the boundaries (5) ahead of the bow echo. (8) shows a
meso-scale intense straight line wind (nearing 48 m/s). Fig 3c show an isolated
thunderstorm with a mesocyclone (4). Boundaries (5) can be seen and to be associated
with the entire mesoscale convective complex and not just one individual cell. Fig. 3d
shows the splitting of an isolated tornado producing storm. The yellow shading is the 40
dBZ contour. Often, cell identification thresholds are set lower (30 or 35 dBZ) in an
attempt to get earlier cell detections but this demonstrates that this results in detecting
different storm structures.
Not discussed here is the identification of the initiation phase of convective weather (Wilson
et al, 1998). Significant progress has been made in the warning of air mass thunderstorms. In
the past, these were considered random and unforecastable. Wilson et al (1998) demonstrate
that they are not random but form on boundaries (see the fine lines on Fig. 3c). Roberts et al