Geoscience Reference
In-Depth Information
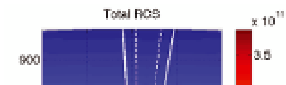
Fig. 16. Co-polarized (left panel), cross-polarized (middle panel), and total (right panel)
backscattered power detected by a pair of orthogonal linearly polarized antennas (see
caption of Figure 15). Power levels are displayed in units of electron density. In each plot, the
dashed white lines indicate the directions half a degree away from perpendicular to
B
, while
the continuous lines correspond to the directions one degree off.
no ionosphere, signal returns will be detected only by the co-polarized antenna (i.e., by the
same antenna used on transmission). However, as the signal propagates farther through the
ionosphere, magnetoionic effects start taking place. We can appreciate that, for most of the
propagation directions, the polarization vector of the detected field rotates such that signal
from one polarization goes to the other as the radar range increases (Faraday rotation effect).
Note, however, that there is a direction in which the wave polarization does not rotate much.
In this direction, the antenna beams are pointed perpendicular to the Earth's magnetic field,
and it can be observed that the polarization of the detected fields varies progressively from
linear to circular as a function of height (Cotton-Mouton effect). Finally, note that at higher
altitudes, where the ionosphere vanishes, no more magnetoionic effects take place, and the
polarization of the detected signal approaches a final state.
Next, scattering and propagation effects are considered in the simulation of the backscattered
power collected by the pair of orthogonal antennas described above. The incoherent scatter
volumetric RCS formulated in the previous section is used in the calculations. In Figure 16,
the simulated co-polarized (left panel) and cross-polarized (middle panel) power data are
displayed as functions of distance and altitude from the radar. In addition, the right panel
depicts the total power detected by both antennas. Note that power levels are displayed as
volumetric radar cross sections divided by 4
r
e
(i.e., power levels are in units of electron
density). In each plot, the dashed white lines indicate the directions half a degree away from
perpendicular to
B
, while the continuous lines correspond to the directions one degree off.
π
In the plots, we can observe that there is negligible backscattered power at low altitudes.
At higher altitudes between approximately 200 and 700 km (where polarization effects are
significant), co- and cross-polarized power maps exhibit features that are similar to the
ones observed in Figure 15. Note, however, that there is an enhancement of the detected
power in the direction where the antenna beams are pointed perpendicular to
B
; this can be
observed more clearly in the plot of the total power (right panel of Figure 16). This feature