Geoscience Reference
In-Depth Information
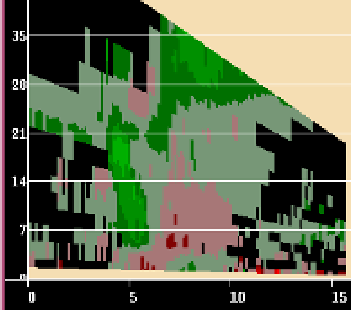
generated by subsequent storm. From the vertical cross section of the velocities it is evident
that the positive velocity perturbation (toward the radar) ends at about 4000 ft, above which
the ambient flow (green color) resumes. The velocities measured by the radar can quantify
the structure of the perturbation, tell the thickness and wavelength. Propagation speed can
be estimated by tracking the wave position in space and time.
Fig. 16. Vertical cross sections of reflectivity field (left) and Doppler velocity field through a
microburst reconstructed from conical scans (up to 19.5
o
elevation) of the WSR-88D radar in
Phoenix Az on Aug 15, 1995. Height is in kft and distances are in nautical miles. The radar is
located to the right of each cross section (at about 26 nautical miles). The top color bar
depicts velocity categories in non linear increments with red away from the radar: light red
= 0-5 kts, dark red 5 to 10, next 10-20; green indicates toward the radar in categories
symmetric to red. The bottom bar refers to reflectivities starting at 0 dBZ in steps of 5 dBZ
(white category indicates values larger than 65 dBZ).
Fig. 17. Doppler velocities at 0.5
o
elevation and superposed vertical cross sections of the
velocities obtained with Oklahoma City radar on Aug 10, 2011. Red color indicates motion
away and green toward the radar located ESE of the bottom right corner. Height lines are in
kft above ground level.