Geoscience Reference
In-Depth Information
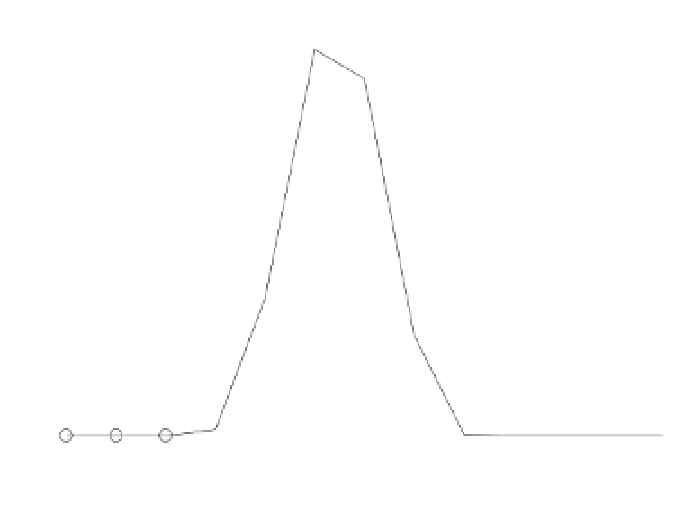
0.3
Model
Data
0.25
0.2
0.15
0.1
0.05
0
266
268
270
272
274
276
278
Azimuth gate
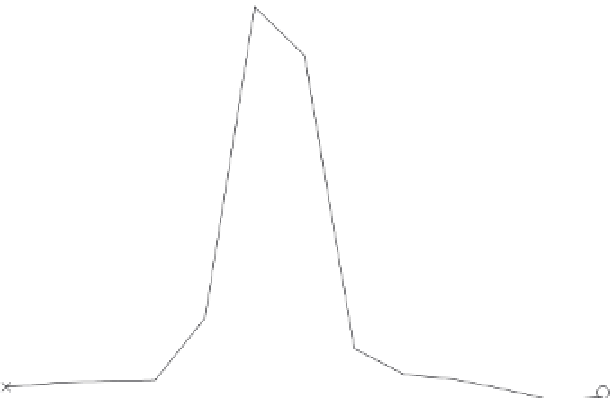
Fig. 9. Blockage caused by an air-traffic control tower at Arlanda Airport. Data and model.
(2008); Høye (2007). Here we describe a simple and computationally light method to calculate
blockage caused by an obstacle.
As a first approximation of the reduction in returned power due to an obstacle we consider
the obstacle's geometrical cross section. Convolving the obstacle's cross section with the radar
beam's power flux and dividing by the total power from an unperturbed beam we obtain the
fraction of power,
P
B
, blocked by the obstacle. To find the corresponding reduction in rain
rate we start by noting that 1
−
P
B
is the amount of power that is unaffected by blockage. The
(unaffected) power is proportional to the linear radar reflectivity factor
z
according to Eq. (2)
and
z
is in turn related to rain rate
R
by
z
R
1.5
. Hence the reduction in rain rate,
R
B
,canbe
∝
1/1.5
.
=
−
(
−
)
expressed as
R
B
1
1
P
B
Applying this method to the Arlanda air-traffic control tower described in Section 3.2.1 we
can estimate the reduction in rain rate it causes. The modelled reduction in rain rate is shown
in Fig. 9 together with the observations. The model is seen to capture the magnitude and the
cross-range shape of the blockage. This model can be used for estimating blockage caused by
wind turbines, but for reasons explained in Section 3.2.1 there are no observations to compare
these results with.
3.2.3 Mitigation concepts
Methods proposed to prevent or reduce blockage by wind turbines include:
• Optimising the placement of the wind turbines. Wind turbines should preferably be placed
out of the line of sight of the radar. Otherwise it has been suggested that wind turbines
should be arranged radially from the radar. In this way the blockage caused by the wind