Geoscience Reference
In-Depth Information
200
150
100
50
0
1980
1985
1990
1995
2000
2005
2010
Year
8
6
4
2
0
1980
1985
1990
1995
2000
2005
2010
Year
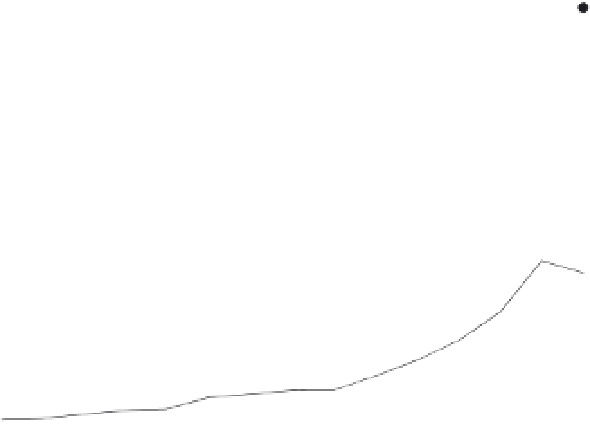
Fig. 1. Rotor diameter (top) and power (bottom) for a selection of large wind turbines
introduced on the market during the period 1981-2011. Gray lines show superimposed
trends. Data from The Wind Power (www.thewindpower.net) and wind turbine
manufacturers' homepages.
Global cumulative installed wind capacity
200
150
100
50
0
1996
1998
2000
2002
2004
2006
2008
2010
Year
Global annual installed wind capacity
40
30
20
10
0
1996
1998
2000
2002
2004
2006
2008
2010
Year
Fig. 2. Global cumulative installed wind capacity (top) and global annual installed wind
capacity (bottom). Data from Global Wind Energy Council (2011).