Geoscience Reference
In-Depth Information
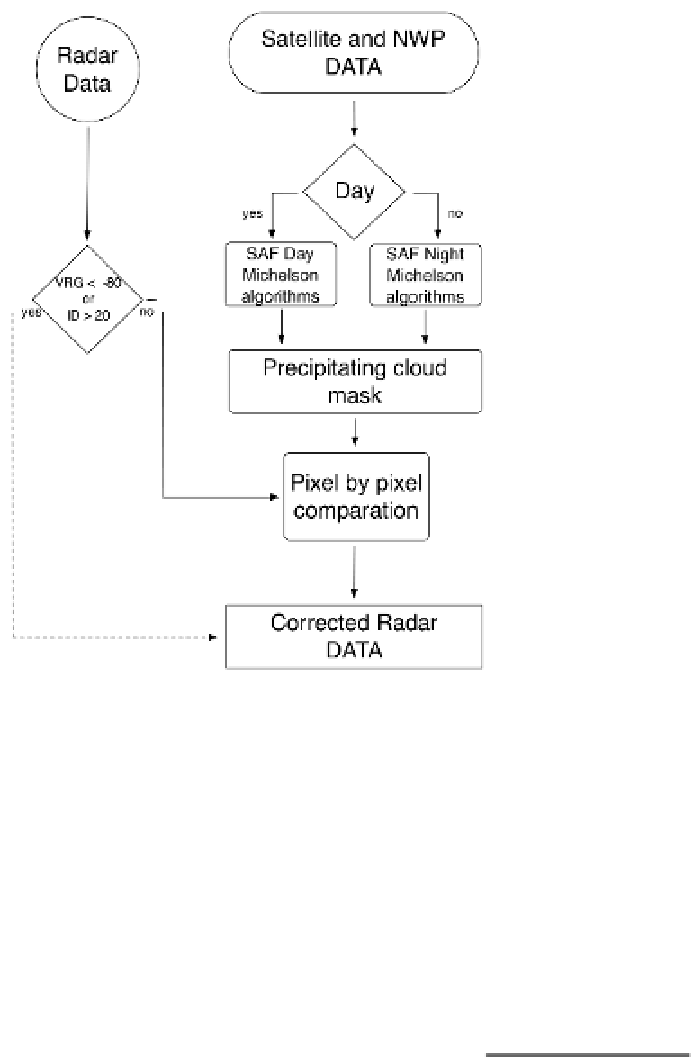
Fig. 18. Flow diagram showing the main processes involved in the algorithm to detect radar
AP echoes with precipitating cloud masks derived from satellite images. Adapted from
Magaldi et al. (2009).
6.2 Results
Using the SMC Vallirana radar (Fig. 17) and a network of 155 raingauges and manually
edited radar data as verification data sets, Magaldi et al. (2009) tested the performance of
this procedure for several case studies, considering the original uncorrected data (UC), and
data corrected with the M and S algorithms, all compared against manually corrected data.
They obtained statistics considering Percentage Correct (PC), False Alarm Rate (FAR), and
Hanssen-Kuipers skill (HKS) scores - see Wilks (1995) for details. The HKS suggested that S
performed better, despite for strong echoes M yielded lower false alarms (Table 4).
Echo
class
Mean
sample
FAR
PC
HKS
UC
M
S
UC
M
S
UC
M
S
Weak
883713
0.34
0.28
0.21
78.12
92.65
96.59
0.80
0.74
0.96
Strong
769162
0.25
0.07
0.37
73.12
94.21
95.81
0.88
0.87
0.80
All
929055
0.30
0.22
0.27
75.55
93.16
96.35
0.83
0.78
0.90
Table 4. Verification scores for different echo intensities (strong echoes are higher than 15
dBZ; weak, the rest).