Geoscience Reference
In-Depth Information
conditions and individual ducting events were examined in detail. Here we illustrate some of
the results obtained assuming standard propagation conditions.
Figure 13 shows details of Bømlo radar (59.5ºN, 5.1ºE) from the Norwegian Meteorological
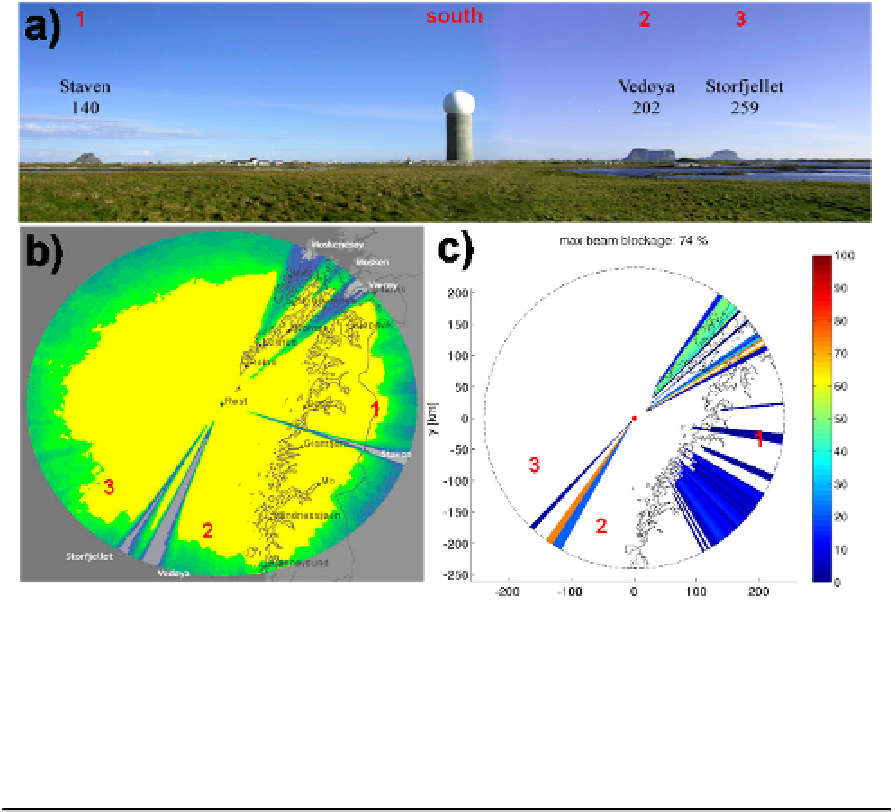
Service (met.no). A panorama from the radar site shows some of the hills which block the
radar coverage (three of them are numbered). One year of precipitation, illustrating the
blocked areas is also shown, as well as the correction factors computed with the BPM model.
The improvement in the bias, defined here as 10 times the decimal logarithm of the ratio of
gauge to radar derived precipitation amounts, is shown in Table 3. At all ranges the
correction reduced the bias.
Fig. 13. a). Southern view from the Bømlo radar in Norway; three of the surrounding hills
are numbered and indicated on the other panels. b). One year of radar precipitation
estimates, illustrating clearly the blocked sectors with less (or no) precipitation. c). Modelled
blockage with the BPM system. Figure courtesy of Dr. Uta Gjertsen (met.no).
Blockage
(%)
Range (km)
40-100 100-160 160-240
0 2.3 (12) 5.2 (19) 11.2 (16)
1-50 4.2
3.1
(16) 9.3
8.5
(26) 15.0
14.1
(70)
50-70 8.6
6.0
(5) 14.4
11.8
(15) 21.4
18.2
(29
)
Table 3. Bias (dB) of uncorrected and blockage-corrected (bold) radar estimates from the
Bømlo radar for 2004 grouped in different ranges. Sample size is in parentheses. Adapted
from Bech et al. (2007b).