Geoscience Reference
In-Depth Information
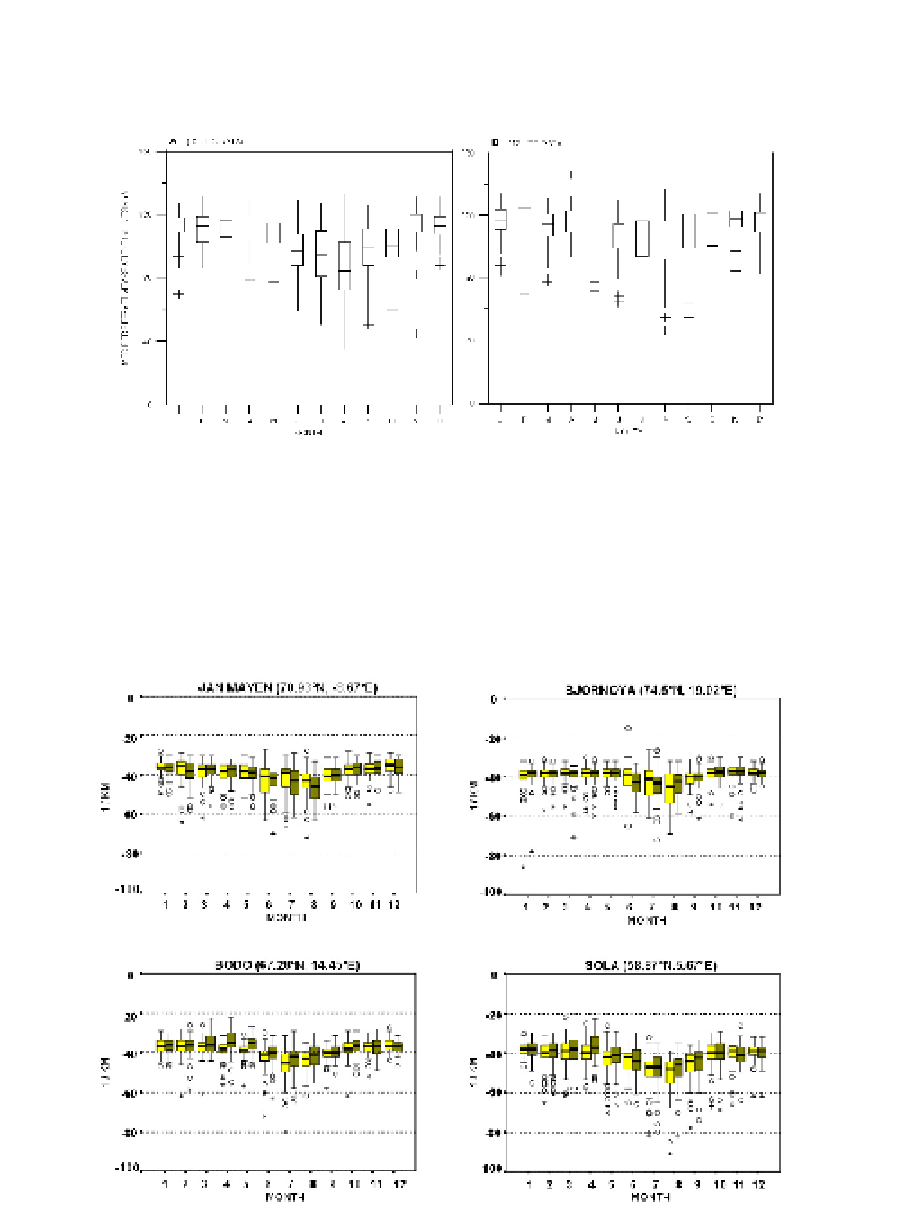
3.2 Vertical refractivity gradient
Vertical refractivity gradient in the first 1000 m (VRG) exhibits, like
N
s
, lower values for
night conditions and a similar seasonal pattern both in the 00 Z & 12 Z data (Fig. 5).
Fig. 5. Box-whisker plots of VRG in Barcelona for 00 Z and 12 Z data.
These box plots show that in summer not only there is a minimum monthly median value
(August), but also that the interquartile range (IQR) is increased compared to cold months.
Another significant feature is that outliers seldom represent subrefractive events but are
quite common for superrefraction; besides, they appear almost at any month, in particular
for 12Z data. A similar behaviour is observed using 2 years of radiosonde data recorded at
several northern latitude observatories (Fig. 6).
Fig. 6. Box-whisker plots for several Norwegian radiosonde sites showing 00 Z (clear boxes)
and 12 Z (dark boxes) data. Adapted from Bech et al. (2007b).