Geoscience Reference
In-Depth Information
rotation with a vertical vorticity of 0.08 s
-1
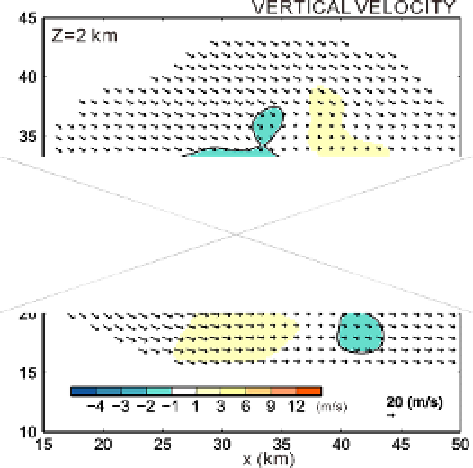
was simulated along with this strong vertical
velocity (Fig. 4). At 2 km ASL, the downdraft in the heavy precipitation region (maximum
velocity -3 m s
-1
) covered a broad area to the northeast of the updraft at 2 km ASL.
Fig. 3. CReSS model-simulated mixing ratio of rain at 4 km ASL. Updraft speeds are shown
as solid contours with a contour interval of 5 m s
-1
. Downdraft speeds are shown as dashed
contours with a contour interval of 1 m s
-1
. Winds are shown for all grid points where the
vertically integrated mixing ratio of rain exceeded 0.0 kg kg
-1
.
Fig. 4. CReSS model-simulated horizontal winds (vectors) and vertical velocity (shading) at 2
km ASL. Solid contours indicate updrafts at 3 m s
-1
contour intervals and downdrafts at 1 m s
-1
contour intervals. A vertical cross-section along the thick horizontal line is shown in Fig. 5.