Geoscience Reference
In-Depth Information
of a supercell thunderstorm observed near Tokyo on 24 May 2000 (Shimizu et al., 2008). The
numerical simulations are generated using the Cloud-Resolving Storm Simulator (CReSS;
Tsuboki & Sakakibara, 2002). CReSS is a three-dimensional nonhydrostatic model. The
microphysical and other parameterization schemes used in CReSS have been described in
detail by Tsuboki & Sakakibara (2002). The model grid comprises 300 x 300 x 70 grid points,
with grid intervals of 1 km in the horizontal directions. The vertical grid interval increases
with height from 0.2 km near the surface to 0.37 km at the model top. The OSSE focuses on
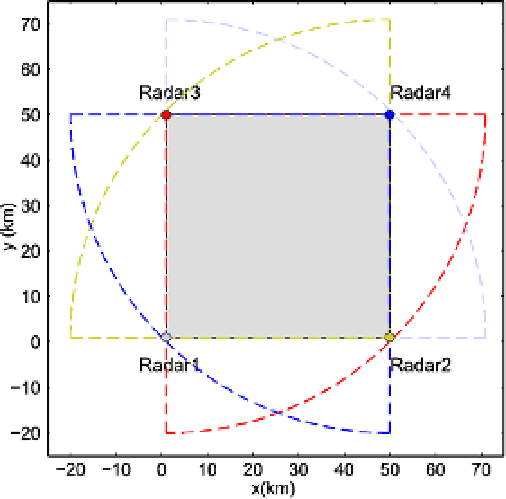
the three-dimensional distribution of wind within a 50 × 50 km domain around the
simulated supercell at 1206 local standard time (LST), assuming that four Doppler radars are
observing the storm (Fig. 1).
Fig. 1. Four radar locations around a simulated supercell storm. The simulated winds are
compared with those derived from radar observations within the shaded region (50 × 50
km). The detection range of the radars is 70 km.
Updrafts associated with the simulated storm reached approximately 12 km above sea level
(ASL). The locations of the four radars are chosen so that the distance between each radar
and the storm is approximately 30-40 km (the supercell is located in the center of the shaded
domain shown in Fig. 1). High elevation angle (~20°) radar scans are required to observe the
storm top. Figure 2 shows the heights of the simulated radar beams. Three different volume
scan strategies are considered in this chapter. The first strategy assumes that one volume
scan consists of 17 PPIs. This strategy corresponds to X-band radar surveillance of a
thunderstorm with echo top below 10 km ASL during an interval of 5-6 minutes. The
elevation angles used in this strategy are 0.7°, 1.2°, 1.7°, 2.2°, 2.8°, 3.3°, 3.9°, 4.7°, 5.6°, 6.5°,
7.4°, 8.3°, 9.3°, 10.3°, 11.8°, 13.5°, and 15.6°. The second strategy adds three high elevation
angles (16.7°, 17.8°, and 18.9°) to the previous volume scan (blue lines in Fig. 2). This
strategy corresponds to a sector- or adaptive-scanning mode (Junyent et al., 2010) for a tall
thunderstorm located near the radar. The third strategy adds nine additional high elevation
angles (20.0°-32.0° spaced at 1.5° intervals) to the preceding volume scan (red lines in Fig. 2).