Geoscience Reference
In-Depth Information
(b)
(a)
60
(d)
(c)
50
40
30
20
10
0
(f)
(e)
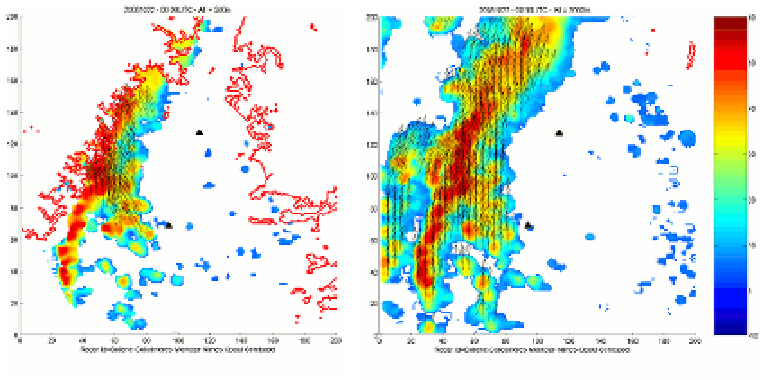
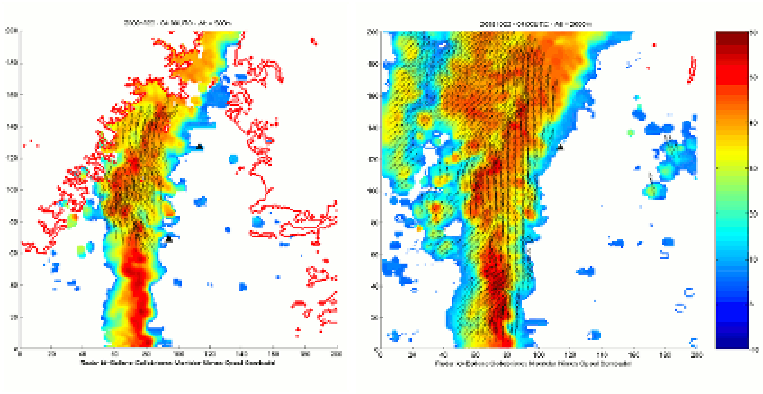
Fig. 15. Horizontal wind vectors superimposed on radar reflectivity (shaded) at 0.5 km (left
panel) and 2.0 km (right panel) AMSL within a 200 km x 200 km experimental domain, as
derived from multiple-Doppler analysis of radar data at (a,b) 00 UTC, (c,d) 04 UTC and (e,f)
08 UTC on 22 October 2008. One every sixth vector is plotted.