Geoscience Reference
In-Depth Information
rainband associated with the cold front that had been moving across France for ~ 24 hours
(Fig. 10i). The various interactions between air masses occurring during the merging process
seemed to reinforce the convective activity along the southern flank of the Massif Central.
The most intense convection was hence observed around 18 UTC (Fig. 10k).
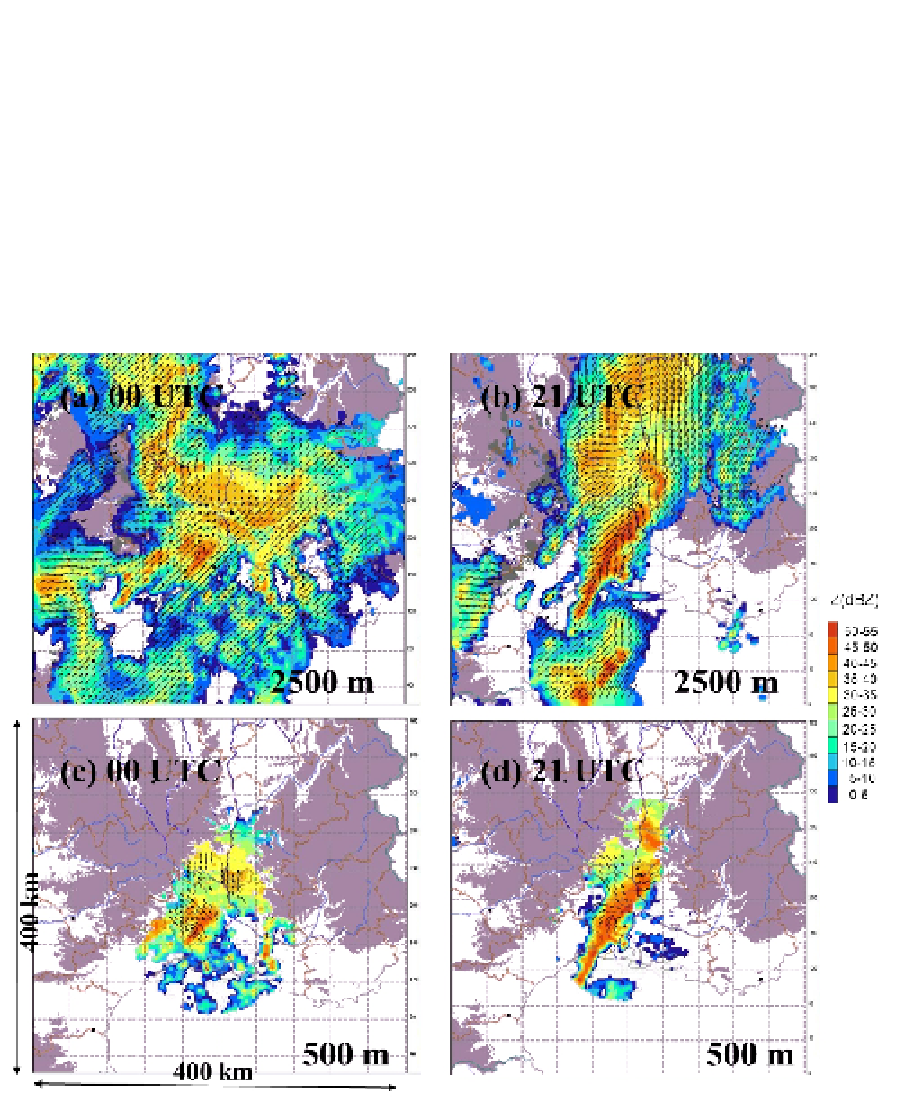
In order to better understand the processes at play in the Cevennes region, Fig. 11 presents a
zoomed view of low and midlevel flow at 00 and 21 UTC, 7 September within a 400 x 400
km
2
domain centered on Nimes. At 00 UTC (Fig. 11c), the low-level flow impinging on the
Massif Central was from the SE and was oriented in a direction almost perpendicular to the
mountains. The maximum convection was observed slightly off the slopes. This is likely due
to the presence of a cold pool below the system, which acted to displace the triggering effect
of the mountains farther south (cold dome effect; Reeves and Lin 2005).
Fig. 11. Multiple-Doppler analysis of radar data within a domain of 400 km x 400 km
centered near Nimes, France valid at 00 UTC and 21 UTC, 7 Sept 2010. Upper panels shows
reflectivity (dBZ) superimposed on horizontal wind vector at 2.5 km AMSL. Lower panels
shows panel shows reflectivity (dBZ) and horizontal wind vectors at 500m AMSL. Grey
shading indicates Massif Central (left) and Alps (right) mountain chains. One every fourth
vector is plotted.