Geoscience Reference
In-Depth Information
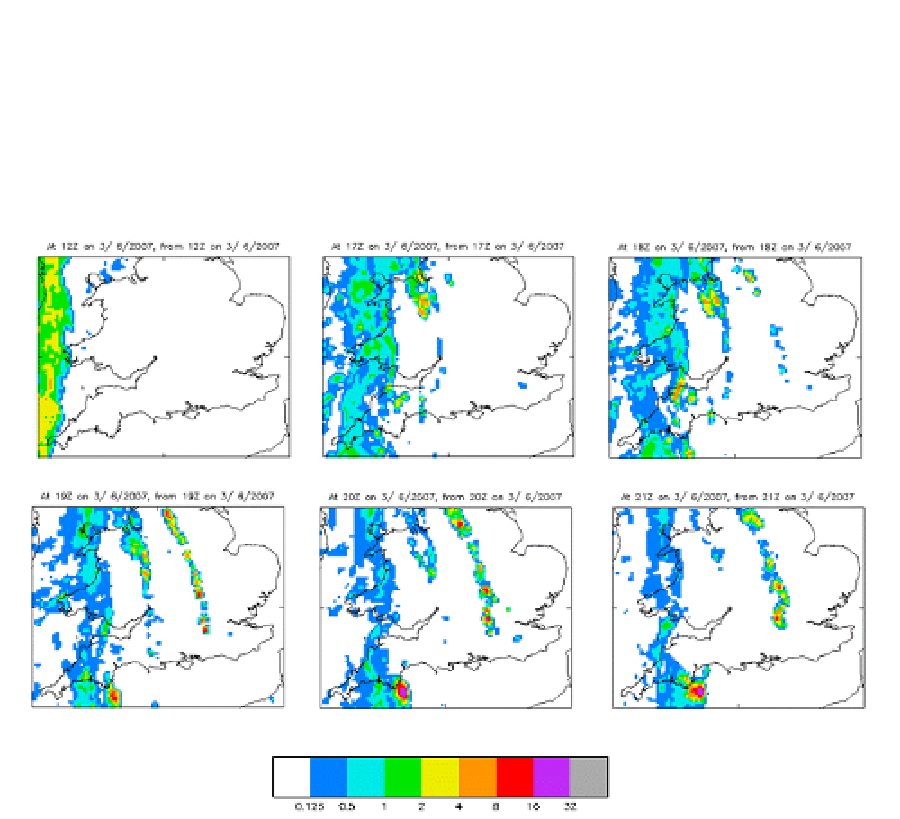
Figure 5 shows the evolution of radar derived surface rain rate between 1200 UTC and
2100 UTC on 3 June 2007. It is apparent that a rain band in the west over Ireland at
1200 UTC reduces in intensity and moves only slightly eastward during the following
9 hours. However, bands to the east develop from about 1700 UTC onwards and intensify.
The STEPS nowcast from 1800 UTC has not been able to reproduce the development of the
eastern-most rain band seen in Figure 5. Nowcasts starting from later analysis times contain
more precipitation but tend, incorrectly, to maintain the shape of individual features.
Fig. 5. Radar derived surface rain rates valid between 1200 UTC and 2100 UTC on 3 June
2007. The data for 1800 UTC, 1900 UTC, 2000 UTC and 2100 UTC were used to derive the
T+3 h, T+2 h, T+1 h and T+0 h STEPS nowcasts shown in Fig. 4. The key shown below
represents precipitation rate in units of mm/h. Note that dry areas are represented by the
colour white.
Figure 6 compares T+1 hour, T+2 hour and T+3 hour 1.5 km NWP-based nowcasts of
surface precipitation all valid at 2100 UTC on 3 June 2007 with radar derived precipitation
rates for the same time. This model has used latent heat nudging of radar derived rain rates
available every 15 minutes, and nudging of hourly humidity derived from 3-D cloud cover
analyses in conjunction with hourly cycles of 4D-Var assimilation of conventional
observations over 1 hour time windows. The NWP nowcasts improve at shorter lead times
due to the benefit of data assimilation. In particular, they benefit from the latent heat
nudging of surface precipitation rates derived from the sub-hourly radar data. In
comparison with the STEPS nowcasts, the 1.5 km NWP nowcast has a better representation
of the rain band in the east at both T+3 hours and T+2 hours. However, the representation of
the rain in the south-west of England is inferior.