Image Processing Reference
In-Depth Information
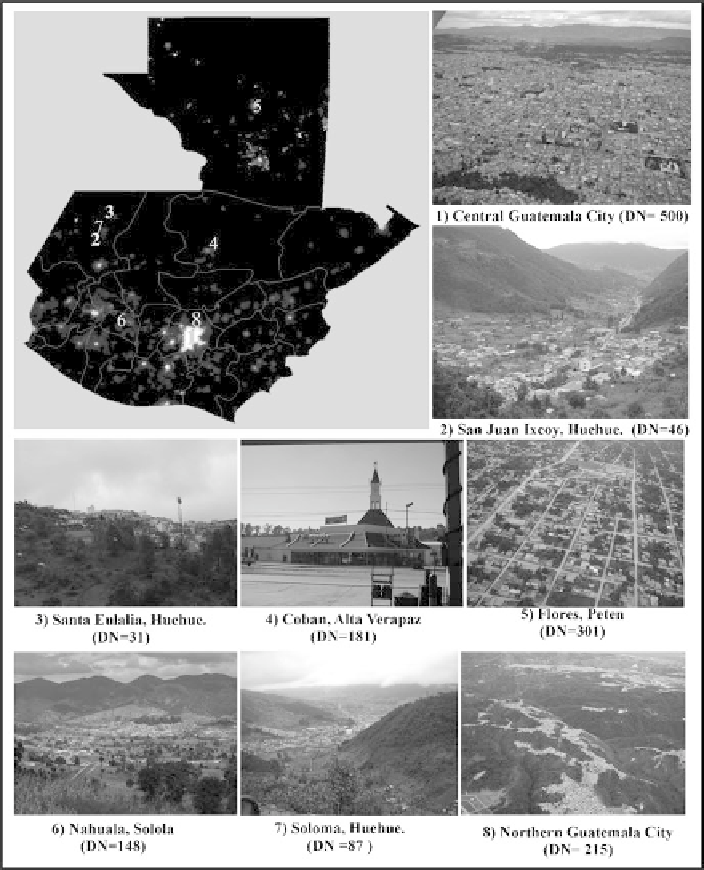
Fig. 17.8
DMSP OLS image of Guatemala and corresponding ground and aerial photographs
aggregated or disaggregated. In this example both population and GDP have
been disaggregated to 1 km
2
resolution in contestable ways (Aker
1969
).
However, local knowledge of Guatemala does suggest that the map does capture
some significant aspects of the spatial distribution of wealth and poverty in
Guatemala. Urban areas and regions of known economic activity show up well on
this map. Note the donut shape of high economic activity around Guatemala City.
This pattern results because central Guatemala City is densely populated. Contrast