Image Processing Reference
In-Depth Information
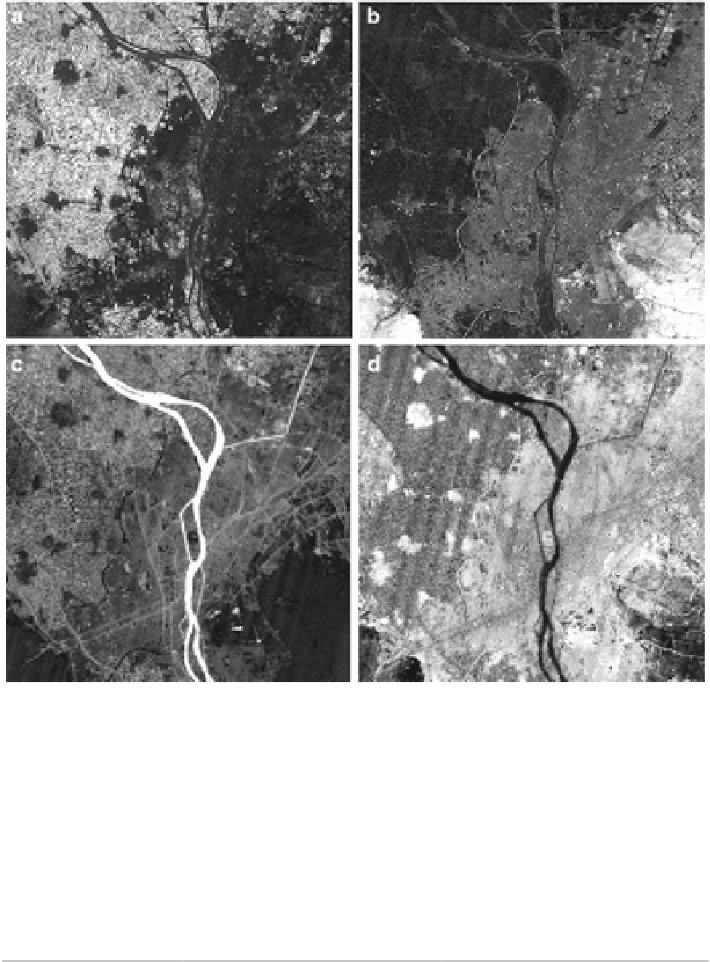
Fig. 6.12
Fraction images produced by the 4-endmember model utilizing vegetation, impervious,
dark soil, and shade. Brighter areas indicate higher abundance while darker areas indicate lower
abundance (Rashed et al.
2001
)
Table 6.5
A comparison between overall classiication accuracy and kappa accuracy for the three
classiications (Rashed et al.
2001
)
Maximum
likelihood
Decision tree based on SMA
Minimum distance
Overall accuracy
89.52
64.51
52.69
Kappa coefficient
0.88
0.59
0.45
•
Multivariate calibration by an Lwin and Maritz (
1980
) technique which uses all
six reflective bands for sub-pixel identification that sum to 100 for each pixel
Display of four fractions in a single color image
•
•
A challenge to the conventional wisdom of “ground truth” wherein the burden
of RS classification is to “match” some other source of presumed correctness