Image Processing Reference
In-Depth Information
Table 6.4
Pixel counts and percent cover o
f
V-I-S components in four study sites (Chung
1989
)
Vegetation
Impervious
Soil
Water
Study Site
Vts
Vg
Ia
Ic
Ir
S
W
Totals
Industrial
Count
40
5
709
0
310
0
0
1,064
%
4
0
67
0
29
0
0
100%
4%
96%
0%
0%
CBD
Count
53
12
370
0
245
0
0
684
%
8
2
54
0
36
0
0
100%
10%
90%
0%
0%
Liberty
Count
232
118
160
5
205
10
14
744
%
31
16
22
1
28
1
2
100%
47%
50%
a
1%
2%
Sugar
Count
173
173
87
11
129
33
6
612
%
28
28
14
2
21
5
1
100%
57%
a
37%
5%
1%
a
Rounding causes irregularities in some totals
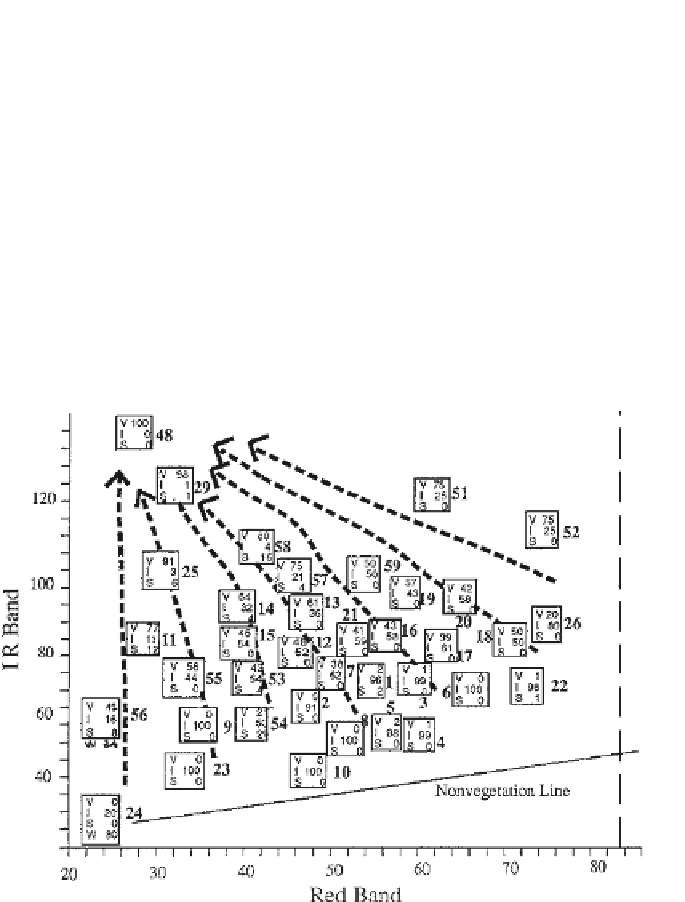
Fig. 6.9
Enlargement of a portion of a 60-class unsupervised plot illustrating V-I-S components
of spectral classes. Arrows demonstrate an increasing V component from the non-vegetation line
(0%) to the green corner, class 48, at 100% (Chung
1989
)
environmental character. Those colors are then applied to a per-pixel classification
to illustrate the V-I-S composition of Salt Lake City (see Fig.
6.11
). Those familiar
with the city readily identify with this environmental display.