Environmental Engineering Reference
In-Depth Information
(a)
(b)
(220)
(111)
d=0.206nm
CdS(220)
(311)
d=0.177nm
CdS(311)
51/nm
d=0.336nm
CdS(111)
100 nm
5 nm
(c)
(d)
1.40
1.12
1.20
1.00
H
+
H
2
H
2
O
-
-
-
-
0.80
H
2
C
0.55
-
-
-
-
-
-
Visible light
0.60
CB
VB
0.38
-
0.40
0.23
0.23
+
+
+
+
CdS
0.02
0
Pt
H
2
O
H
2
0.20
0
G
Samples
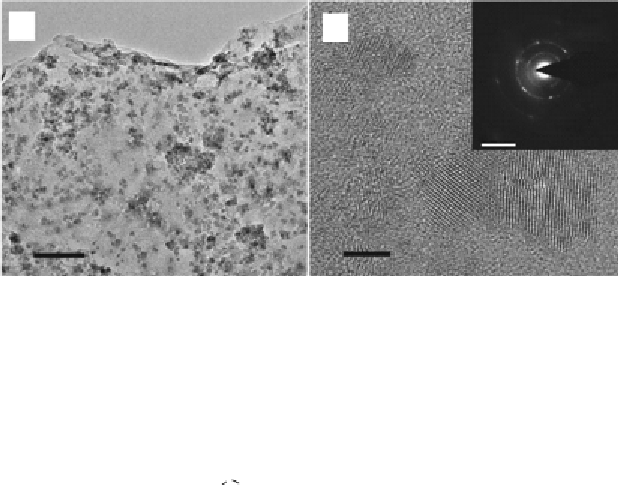
FIGURE 3.3
(a,b) TEM images of graphene sheet decorated with CdS clusters. Inset: SAED pattern
collected at the composite structure. (c) Schematic illustration of the charge separation and transfer in
the graphene-CdS system under visible light. (d) Comparison of the visible light photocatalytic activity
of graphene-CdS systems with different graphene loading for the H
2
production using 10 vol% lactic
acid aqueous solution as a sacrificial reagent and 0.5 wt% Pt as a co-catalyst.
Source
: Reproduced with
permission from Li et al. [30]. (See color insert.)
graphene sheet; and (3) to Pt nanoparticles located on the graphene sheets.
Eventually, the electrons will react with the absorbed proton to form H
2
[30].
The H
2
production rate was noticeably increased with the loading of even a
small amount of graphene (0.5-2.5 wt%). When 1.0 wt% of graphene was
loaded, the H
2
production rate reached the optimal value of 1.12 mmol h
−1
,
with a quantum efficiency of 22.5% at 420 nm. The enhanced photoactivity
of CdS-graphene composite was attributed to the efficient charge separation
of photoexcited carriers. On the other hand, the overloading of black gra-
phene led to shielding of the active sites on the active sites on the catalyst
surface and rapidly reduced the intensity of light through the depth of the
reaction solution and thus the photoactivity. The results also prove that the
bare graphene sheets without CdS cluster were not active for photocatalytic


Search WWH ::

Custom Search