Information Technology Reference
In-Depth Information
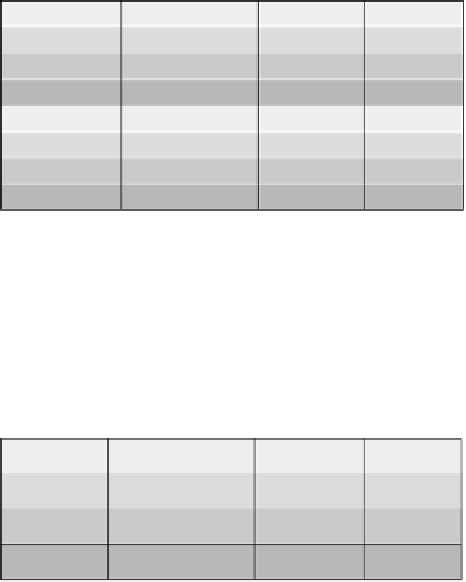
TABLE 2.1 Survial Rates of Men and Women
a
Survived
Died
Total
Men
10
0
10
Women
3
11
14
Total
13
11
24
Survived
Died
Total
Men
8
2
10
Women
5
9
14
Total
13
11
24
a
In terms of the Relative Survival Rates of the Two Sexes,
the first of these tables is more extreme than our original
table. The second is less extreme.
and women profit the same from treatment if we had observed a table of
the following form?
Survived
Died
Total
Men
0
10
10
Women
13
1
14
Total
13
11
24
Of course, we would! In determining the significance level in the
present example, we must add together the total number of tables that lie
in either of the two extremes or tails of the permutation distribution.
The critical values and significance levels are quite different for one-
tailed and two-tailed tests; all too often, the wrong test has been
employed in published work. McKinney et al. [1989] reviewed some 70
plus articles that appeared in six medical journals. In over half of these
articles, Fisher's exact test was applied improperly. Either a one-tailed test
had been used when a two-tailed test was called for or the authors of the
paper simply hadn't bothered to state which test they had used.
Of course, unless you are submitting the results of your analysis to a
regulatory agency, no one will know whether you originally intended a
one-tailed test or a two-tailed test and subsequently changed your mind.
No one will know whether your hypothesis was conceived before you
started or only after you'd examined the data. All you have to do is lie.
Just recognize that if you test an after-the-fact hypothesis without identify-
ing it as such, you are guilty of scientific fraud.
When you design an experiment, decide at the same time whether you
wish to test your hypothesis against a two-sided or a one-sided alternative.