Information Technology Reference
In-Depth Information
A
C
1.1
J
B
1.2
1.3
2.1
2.2
2.3
0.00
0.04
0.08
0.12
0.16
0.20
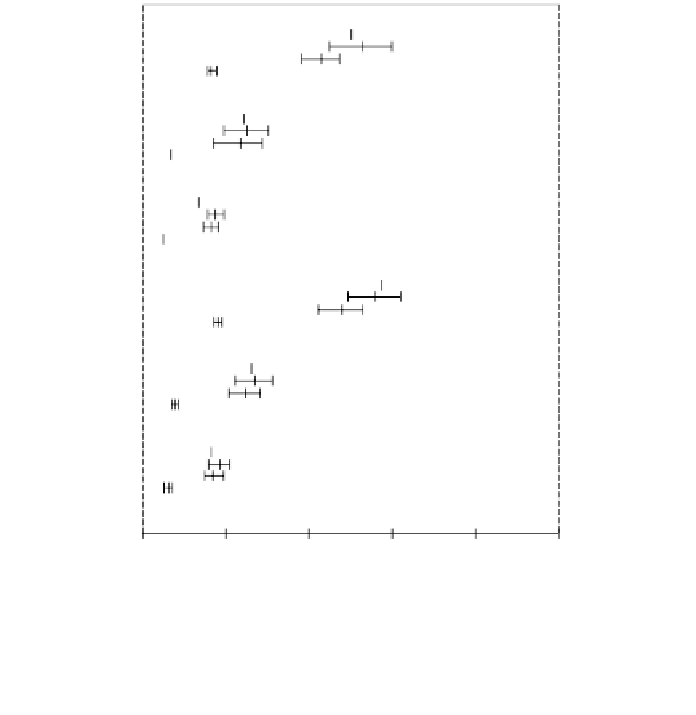
FIGURE 3
95% (nonsimultaneous) Confidence Intervals for RMSE
2
. In each set
of simulations, there are four confidence intervals for, respectively, apparent (A),
cross-validation (C), jackknife (J), and bootstrap (B) estimates of the expected
excess error. Notice that
app
∫ 0, so RMSE
2
(
app
) is the expected excess error,
a constant; the “confidence interval” for RMSE
2
(
app
) is a single value, indicated
by a single bar. In addition, RMSE
2
(
ideal
) = 0 and its confidence intervals are not
shown. Some of the bootstrap confidence intervals are so small that they are
indistinguishable from single bars.
r
r
r
r
performed several simulations with a flavor similar to mine. I report on
only one of his simulations here. When the prediction rule is the usual
Fisher discriminant and the training sample consists of 14 observations
that are equally likely from
N
((-
2
, 0),
I
) or
N
((+
2
, 0),
I
), then the
RMSE
1
of apparent, cross-validation, bootstrap, and ideal estimates are,
respectively, 0.149, 0.144, 0.134, and 0.114. Notice that the RMSE
1
's of
cross-validation and apparent estimates are close, whereas the RMSE
1
of
the bootstrap estimate is about halfway between that of the ideal and
apparent estimates.
In the remainder of this section, I discuss the sufficiency of the number
of bootstrap replications and the number of experiments.
Throughout the simulations, I used
B
= 100 bootstrap replications for
each experiment. Denote