Information Technology Reference
In-Depth Information
0.8
0.75
African-American
Hispanic
0.7
0.65
0.6
0.55
0.5
1974
1976
1978
1980
1982
1984
1986
1988
1990
Year
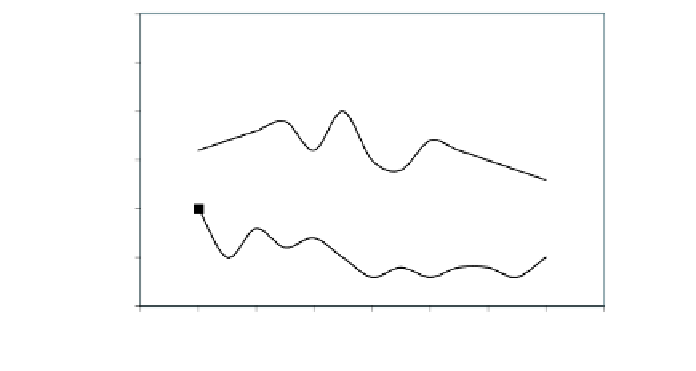
FIGURE 8.11
Median Family Income of African-Americans and Hispanics
Divided by the Median Family Income for Anglo-American Families for Years
1976-1988.
Problem:
The legend identifies the two ethnic groups in the reverse
order that they appear in the plot. It is easy to confuse the polylines due to the
discrepancy in organizing the identifiers. The rule is that if the data follow a
natural ordering in the plotting region, the legend should honor that order.
10
Surfactant 1
Surfactant 2
Surfactant 3
8
6
4
2
0
1
2
3
Fat type
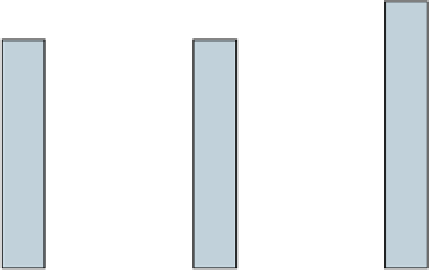
FIGURE 8.12
Volume of a Mixture Based on the Included fat and Surfac-
tant Types.
Problem:
As with a scatterplot, the arbitrary decision to include zero
on the
y
axis in a bar plot detracts from the focus on the values plotted.