Information Technology Reference
In-Depth Information
24
22
20
18
16
14
12
10
1
2
3
4
5
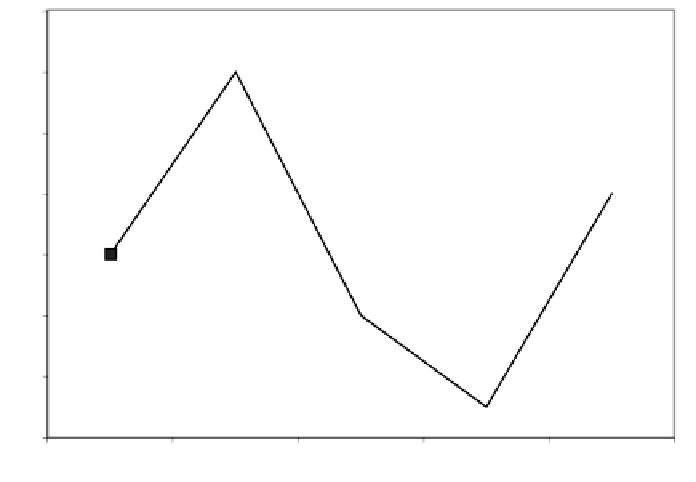
FIGURE 8.6
Total Number of Goals Scored by Teams 1 through 5.
The
x
axis indicates the team number, and the
y
axis indicates the number of goals scored
by the respective team.
Problem:
The inclusion of a polyline connecting the five
outcomes helps the reader to visualize changes in scores. However, the categorical
values are not ordinal, and the polyline indicates an interpolation of values that
does not exist across the categorical variable denoting the team number. In other
words, there is no reason that Team 5 is to the right of Team 3 other than we
ordered them that way, and there is no Team 3.5 as the presentation seems to
suggest.
Team 4
Team 3
Team 1
Team 5
Team 2
10
12
14
16
18
20
22
24
FIGURE 8.7
Total Number of Goals Scored by Teams 1 through 5.
The
x
axis indicates with a square the number of goals scored by the respective team.
The associated team name is indicated above the square. Labeling the outcomes
addresses the science of the KISS specification given at the beginning of the
chapter.
of the information. If the required number of rows for a tabular presenta-
tion would require more than one page, the graphical representation is
preferred. Usually, if the amount of information is small, the table is pre-
ferred. If the scale of the information makes it difficult to discern other-
wise significant differences, a graphical presentation is better.