Information Technology Reference
In-Depth Information
25
20
15
0
1
2
3
4
5
6
10
5
0
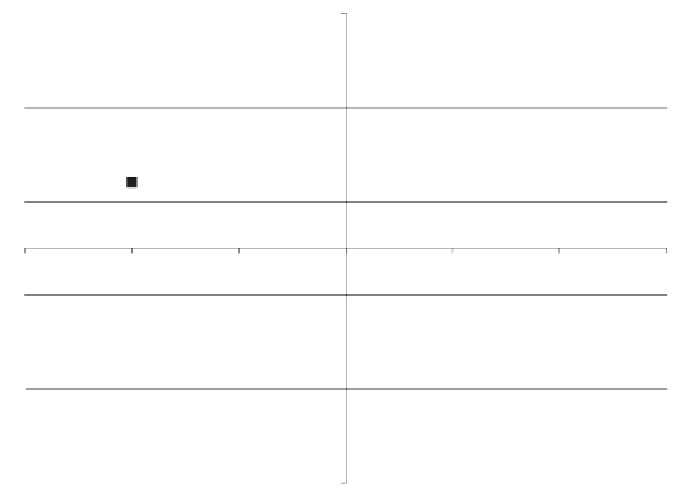
FIGURE 8.3
Total Number of Goals Scored by Teams 1 through 5.
The
x
axis indicates the team number, and the
y
axis indicates the number of goals scored
by the respective team.
Problem:
Placing the axes inside of the plotting area effec-
tively occludes data information. This violates the simplicity goal of graphics; the
reader should be able to easily see all of the numeric labels in the axes and plot
region.
Figure 8.5 eliminates the extra space included in Figure 8.4 where the
vertical axis is allowed to more closely match the range of the outcomes.
The presentation is fine, but could be made better. The data of interest in
this case involve a continuous and a categorical variable. This presentation
treats the categorical variable as numeric for the purposes of organizing
the display, but this is not necessary.
Rule 4:
Carefully consider the nature of the information under-
lying the axes. Numeric axis labels imply a continuous range of
values that can be confusing when the labels actually represent
discrete values of an underlying categorical variable.
Figures 8.5 and 8.6 are further improvements of the presentation. The
graph region, area of the illustration devoted to the data, is illustrated with
axes that more closely match the range of the data. Figure 8.6 connects
the point information with a line that may help visualize the difference
between the values, but also indicates a nonexistent relationship; the