Biomedical Engineering Reference
In-Depth Information
through the device. The implant was loaded
with a
day
n
i
σ
basi
), in which
σ
basi
is the tissue
stress generated by a single load cycle at the
tissue equilibrium stage, and
n
i
is the number
of cycles of load type
i
per day.
An idealized fi nite element model was further
constructed to predict bony patterns by using
adaptive methods. It was assumed that during
healing, cells continuously modify the mineral
density of the surrounding bone, according to
the equation
r
ψ
bas
=
(
6
.
5
N force, with a cyclic square wave at
1
cycles/day). The implant was immo-
bilized and allowed to heal for
Hz (
600
month prior
to loading. Microcomputer tomographic (
1
CT)
scans were used to determine the peri-implant
bone density of the experimental implants.
The three-dimensional osseous architecture
of the
µ
CT images showed qualitatively higher
bone density, thicker trabeculae, and fewer
intertrabecular spaces surrounding the
µ
=
c
*(
ψ
b
−ψ
bas
), in which
Ψ
bas
is
5
-
day
n
i
σ
bi
) created
by the loading device. In this equation, the dif-
ference between a daily tissue-level stress stim-
ulus and the attractor state stress stimulus is
named the tissue-remodeling criterion. In our
study, the increase (positive) of the remodeling
criteria (MPa/day) would raise the elastic
modulus of bone proportionally to the increase
of bone density, and vica versa. The variable
c
is an empirically determined value and was
set to equal one [(MPa/day)/(MPa/day)] in our
case. This remodeling equation was adapted
from Beaupre et al. [
the daily stress stimulus
ψ
b
=
(
month-loaded implants [
]. The trabeculae
appeared to orient in a specifi c apical direction
running from the cortical shell to the implant;
this suggests that there was an adaptation re-
sponse to loading. This adaptation reached
remodeling equilibrium at sites where tissues
received daily attractor stress
68
Ψ
bas
, the stress
value of which provides adequate stimuli to
bone cells for maintaining a balance between
formation and resorption [
14
,
15
]. Based on the
µ
CT image, a two-dimensional fi nite element
model was constructed and used to determine
the daily attractor stress value (Fig.
] for long-bone studies.
Results showed that with the use of tensile
stress criteria, the predicted bony pattern
matched that of experimental
3
). The
model describes the mathematical relationship
8
.
6
µ
CT data (Fig.
8
). Other stress components (e.g., Von Mises
and compressive stress) cannot provide similar
predictions to relate motion-derived stresses
with regenerated bony architecture, thus indi-
cating that the cells in alveolar bone are more
prone to tension stimuli than the cells in long
bone. As described in Section
.
7
and in other
orthopedic literature, compression and shear
stresses provide greater stimulation to long-
bone adaptation than tensile stress. This type
of tensile stress, which stimulates alveolar bone
osseointegration, is consistent with the forces
used for tooth movement. Nevertheless, a peri-
implant ligament analog to the periodontal
ligament does not form, and thus a tension
zone, as seen in normal orthodontic proce-
dures, does not occur. The similarity of tension-
stress effects may be due to the prevalence of
soft callus and progenitor cells in the early
healing stage. The soft callus allows a large
stretch range of the tissues. Fiber extrusion
along the direction of tensile stress, similar to
that observed in distraction osteogenesis,
can occur in the interfacial tissue (Fig.
8
.
4
.
1
.167E-03
1 mm
.333E-03
.500E-03
.667E-03
.888E-03
.100E-03
.001167
.001333
.0015
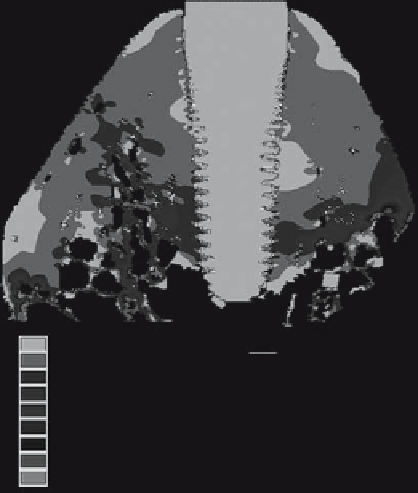
Figure 8.6.
Strain distributions of the implant-alveolar
bone complex were computed based on the outcome of our
previous study [68]. With the use of this model, an equilibrium
stage was reached after a 5-month loading. The tissue strains
around the coronal and middle third of the implant appeared
very uniform. This stress value was taken as the attractor stress
state.
).
This explains why trabecular bone formation
aligns with the principal direction of tensile
stress. The estimated maximum tissue strain
(
8
.
8
70
µε
) was much lower than the MES values