Information Technology Reference
In-Depth Information
The H-GIS has at last developed HuMap, HuTime, the Japanese Historical
Gazetteer Database and the Calendar Database. These tools are in a trial phase, and
they are used by researches. Figure 8 shows some research examples using HuMap
and HuTime. The example (a) is a landscape analysis of sacred places around ancient
Shinto-shrines. The example (b) is a Malaria risk analysis in Thailand, which is a
typical GIS application to health and medical care. The example (c) is a temporal
analysis using weather data (Figure 6 (a)) to find relationship between heavy rainfall,
strong wind, and disastrous events. The example (d) is a spatiotemporal analysis to
find backgrounds that explain pilgrimages of monks in Thailand. These research trials
gradually attract interesting of area studies' researchers. On the other hand, the H-GIS
gets feedbacks from researchers to modify and expand functions of the tools.
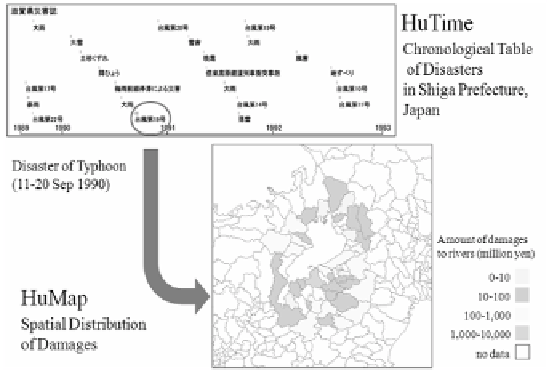
Fig. 9.
A Simulation of Spatiotemporal Analysis by Switching HuMap and HuTime
HuMap has rich spatial functions but limited temporal functions, while HuTime
has no spatial functions but rich temporal functions. The H-GIS is trying to combine
these two tools to create a revolutionary tool that can handle objects on the planes
spanned by the spatial axis and the temporal axis in Figure 2. A map is a “piece” of
the world we see from a narrow window of particular subject and area, and a calendar
is also a “piece” of the world viewed from a narrow window of particular subject and
period. Area studies (and sciences) can be said the processes of reconstructing the
world image from these pieces. A layer in spatiotemporal plane is an image
reconstructed from a pair of map and calendar. Analogically speaking, just as a 3D
human body image can be reconstructed from many pieces of CT images, the world
image can be reconstructed from variety pieces of maps and calendars.
If such a tool is realized, users will be able to analyze objects from spatial and
temporal perspectives simultaneously. However, since maps and calendars have
different layout structures and four dimensions are at least necessary to display them
simultaneously, it is difficult to design such viewers. One solution may be to switch
HuMap and HuTime properly according to users' perspectives. Figure 9 shows a
simulation that visualizes relationships between temporal climates patters and spatial
disasters patterns by switching HuMap and HuTime. Figure 10 shows the schematic