Information Technology Reference
In-Depth Information
immediacy. As it can be seen in the figure, the thumbnail of images configured on the
network camera is displayed. When clicking the buttons just under the small images,
larger image can be displayed at the field next to the thumbnail. In addition, when
clicking a small image by itself, much larger image is displayed on a new window of
web browser.
The graph of data acquired from sensors is shown in Figure 6(b). As it can be seen in
the figure, the ComboBox that enables users select year and month, and day, was
adopted to refer past data. In addition, for farmers to compare their selecting data with
Shodoshima's past mean temperature, the mean temperature of selected month can be
automatically displayed. For the mean temperature, the data from 1979 to 2000 were
used.
Fig. 6.
(a) The web page displaying the latest images and data acquired from sensors. (b) The
graphs of data acquired from sensors.
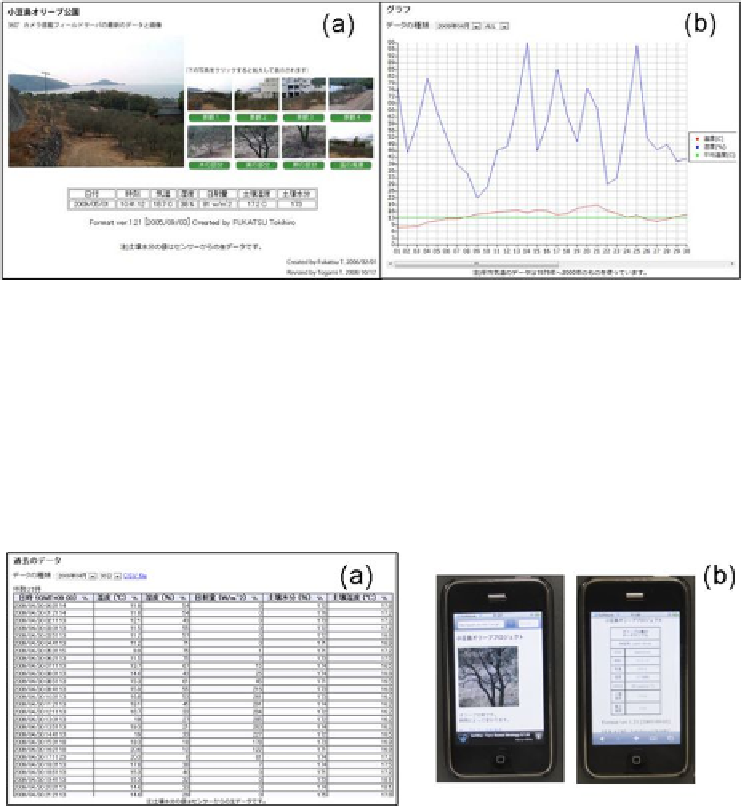
We have arranged the past numerical data for farmers to draw upon the data for
decision making in cultivation management shown in Figure 7(a). From the
information utilization point of view, we have designed the page that allows users
download their selecting data in CSV format so that users can use the data on other
application software and analyze. The reason for the adoption of the data format is
because it has broad utility, which means a lot of software supports the format.
Fig. 7.
(a) The past data reference and download in CSV format. (b) The latest image and
sensed data displayed on a mobile phone.