Environmental Engineering Reference
In-Depth Information
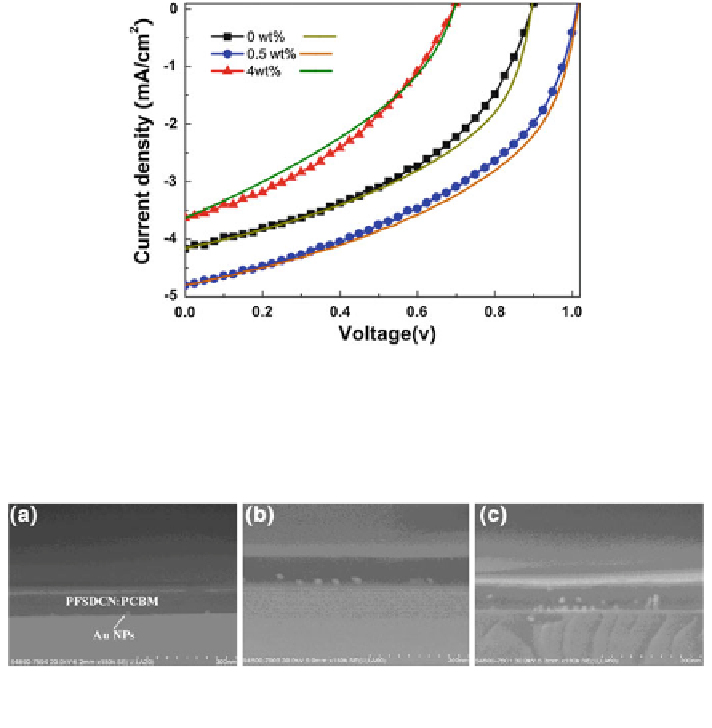
Fig. 8.17 J-V characteristics of the OSCs with different Au NPs concentration under AM 1.5G
illumination at 100 mW/cm
2
. The symbols denote experimental data (squares: without Au NPs;
circles: Au NPs 0.5 wt%; triangles: Au NPs 4 wt%). The solid lines denote theoretical results
[
35
]
Fig. 8.18 SEM cross-section image of the active layer embedding with Au NPs a 0.5 wt%,
b 2 wt% and c 6 wt% [
35
]
cathode metal and the fullerene reduction potential, which can downward shift the
cathode work function and lead to remarkable V
OC
reduction. This can be further
revealed by the SEM cross-section images of the active layer in Fig.
8.18
. With
low concentration of Au NPs (0.5 and 2 wt%), the Au NPs are mostly located near
the bottom of PFSDCN:PCBM (near to the interface with PEDOT:PSS). When
embedding high concentration Au NPs (6 wt%, Fig.
8.18
c), aggregation of NPs is
observed and some are located at the surface of the active layer, which induce a
significant morphology change and V
OC
reduction. The theoretical results show
that the change of work function of the cathode causes the reduction of V
OC
. When
the cathode work function is downward shifting by 0.56 eV, V
OC
reduces to
0.69 V for OSCs with 4 wt% of Au NPs concentration. The other subordinate
factor resulting in V
OC
reduction is that more shunt paths are induced by the Au
NPs, which can be well indicated from the increased reverse current for the OSCs
as the concentration of Au NPs increases. The shunt paths formed directly from
anode to cathode are believed to reduce the V
OC
[
53
,
54
].
Search WWH ::

Custom Search