Environmental Engineering Reference
In-Depth Information
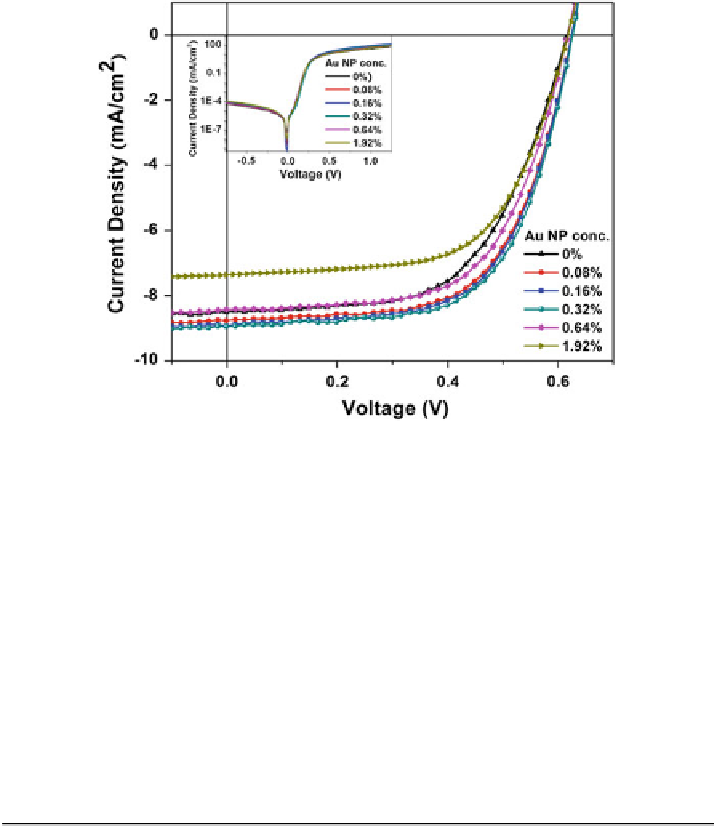
Fig. 8.1 J-V characteristics of solar cells with structures ITO/PEDOT:PSS (with PEG-capped
Au NPs)/P3HT:PCBM/LiF (1 nm)/Al(100 nm), incorporated with different NP concentrations
under AM 1.5G illumination at 100 mW/cm
2
. Inset Dark J-V characteristics of the solar cells
[
18
]
Table 8.1 Device performances for solar cells with structure ITO/PEDOT:PSS(with PEG-
capped Au NPs)/P3HT:PCBM/LiF(1 nm)/Al(100 nm), incorporated with different NP concen-
trations [
18
]
NP conc. (wt %)
J
sc
(mA/cm2)
V
OC
(V)
FF (%)
PCE (%)
0
8.5 ± 0.19
0.62 ± 0.01
58 ± 1.3
3.10 ± 0.10
0.08
8.77 ± 0.23
0.63 ± 0.01
61 ± 1.0
3.40 ± 0.11
0.16
8.93 ± 0.19
0.63 ± 0.01
61 ± 1.1
3.46 ± 0.10
0.32
8.94 ± 0.15
0.63 ± 0.01
62 ± 1.0
3.51 ± 0.09
0.64
8.56 ± 0.11
0.62 ± 0.01
61 ± 1.2
3.21 ± 0.10
1.92
7.36 ± 0.2
0.62 ± 0.01
61 ± 0.5
2.80 ± 0.13
*13 % improvement. Improvements originate from increases in FF and J
sc
, from
0.58 to 0.62 and 8.5-8.94 mA/cm
2
, respectively. Further, increasing the concen-
tration of NPs has detrimental effect on device performances, with PCE dropping
to 2.80 % at 1.92 wt% Au NPs concentration. From the dark J-V characteristics in
the inset of Fig.
8.1
, no significant change in leakage current is observed after
incorporation of Au NPs. The underlying physics of the PCE trend can be explored
by studying the optical and electrical properties as described the following
sections.


Search WWH ::

Custom Search