Environmental Engineering Reference
In-Depth Information
(a)
40
30
20
10
0
(b)
80
10
-4
60
10
-5
40
10
-6
10
-6
10
-5
10
-4
Time / s
20
0
500
1000
1500
Wavelength / nm
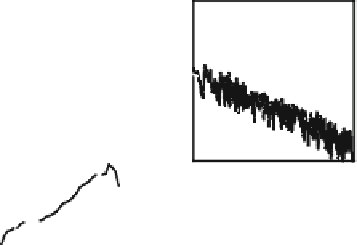
Fig. 5.6 a Transient absorption spectra of RRa-P3HT:PCBM (50:50 w/w) blend films (solid
lines) measured at 0, 0.2, 1, 100, and 3000 ps (from top to bottom). The broken line represents
transient absorption spectrum of an RRa-P3HT pristine film measured at 0 ps. The transient
absorption is corrected for variation in the absorption at an excitation wavelength of 400 nm.
b Transient absorption spectra of RRa-P3HT:PCBM (50:50 w/w) blend films excited at 450 nm
measured at 0.5, 1, 2, 4, and 8 ls (from top to bottom). The inset shows transient absorption
decays at 850 (upper) and 1030 nm (lower). The white broken lines represent fitting curves with a
power-law equation: DOD(t) t
-a
. Adapted with permission from [
19
]. Copyright 2010
American Chemical Society
Figure
5.7
a shows the transient absorption spectra of RR-P3HT:PCBM blend
films from 0 to 3 ns after the laser excitation. In this time domain, as in the case
with RRa-P3HT:PCBM blend films, the absorption spectrum varies with time. The
large absorption band at around 1250 nm is in good agreement with that observed
immediately after the laser excitation of RR-P3HT pristine films as described
above, and therefore can be ascribed to P3HT singlet exciton. As shown in
Fig.
5.7
b, the broad absorption bands at 700 and 1000 nm are still observed on a
time scale of microseconds. Interestingly, these two bands exhibit the power-law
decay dynamics with different exponents, which remain the same under an oxygen
atmosphere. Thus, they can be ascribed to P3HT polarons but must be different
polarons as will be described in detail in
Sect. 5.6.3
. In other words, this spectral
change shows the formation of P3HT polaron from P3HT singlet exciton.


Search WWH ::

Custom Search